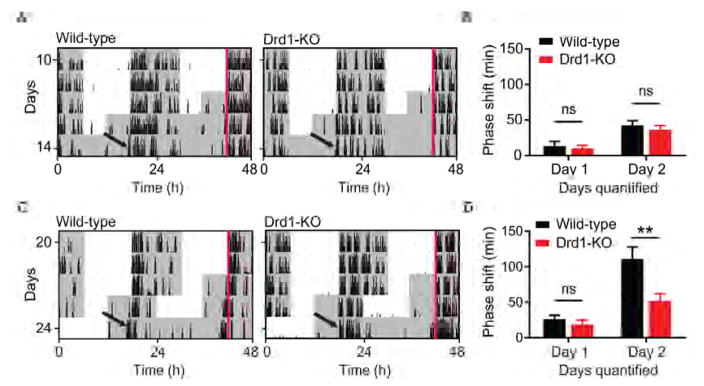
Figure 4. Drd1 Modulation of Entrainment Rate Requires Light Input.
(A) Representative double-plotted actograms of wild-type and Drd1-KO mice following a 6-hour advance and immediate release into DD. (B) Group analysis of day 1 and day 2 cumulative phase shift; F (1, 14) = 0.3684; p = 0.5536, repeated-measures two-way ANOVA; n = 8/group. (C) Representative double-plotted actograms of wild-type and Drd1-KO mice following a 6-hour full LD cycle advance followed by release into DD. Red lines outline ZT 12 prior to LD shift. (D) Group analysis of day 1 and day 2 cumulative phase shift; F (1, 14) = 7.40; p = 0.0166, repeated-measures two-way ANOVA with Bonferroni post hoc comparison; n = 8/group. ** p < 0.01. Data are represented as mean ± SEM.

