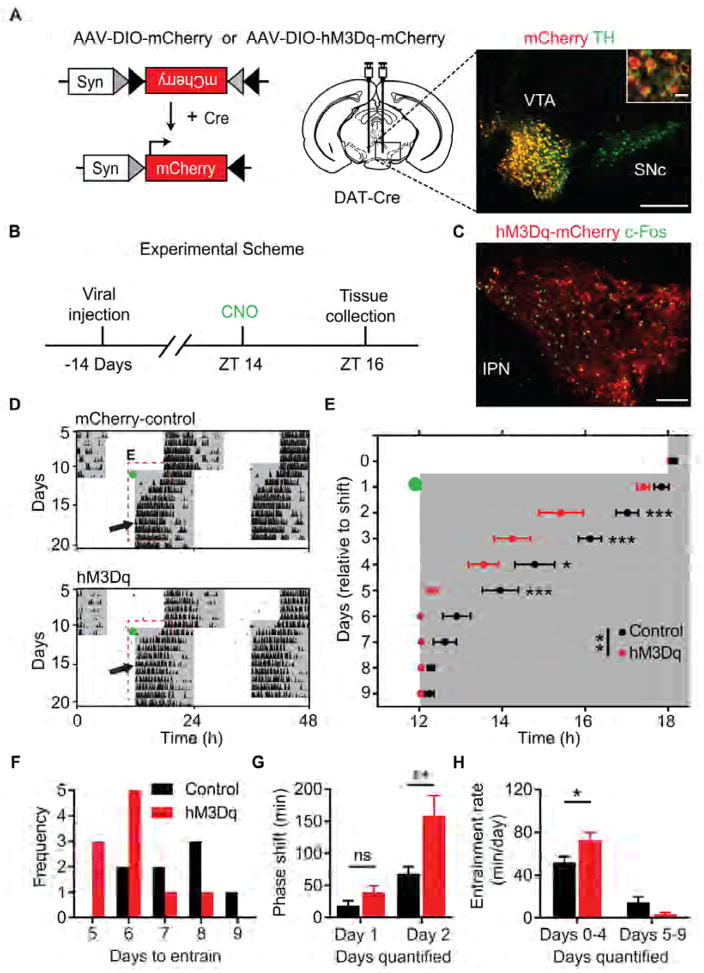
Figure 7. DREADD Activation of VTA Neurons Accelerates Circadian Entrainment.
(A) Left: Design of Cre-dependent control virus, AAV-DIO-mCherry, or excitatory Gq-coupled DREADD, AAV-DIO-hM3Dq-mCherry. Syn: human synapsin promotor; Cre: Cre recombinase. Middle: Schematic illustrating injection site to the midbrain of DAT-Cre mice. Right: double fluorescent immunohistochemistry with mCherry (red) and TH (green) antibody labelling demonstrating selective transgene expression within DA-neurons of the ventral tegmental area. VTA: ventral tegmental area; SNc: Substantia nigra pars compacta. Scale bar, 200 μm; inset scale bar, 20 μm. (B) Timeline of experiment assessing CNO-induced (1mg/kg, i.p.) c-Fos expression two hours after lights-off; Zeitgeber time 14 (ZT 14). (C) Double fluorescent immunohistochemistry with c-Fos (green) and mCherry (red) antibody labelling reveals activation of VTA DA-neurons. Brains were collected for analysis 120 minutes after CNO injection (1mg/kg, i.p.). IPN: interpeduncular nucleus. Scale bar, 100 μm. See also Figure S1. (D) Representative double-plotted actograms of light cycle shift comparing mCherry and hM3Dq-mCherry expressing DAT-Cre mice. Green dots indicate CNO injection (1mg/kg, i.p); black arrows indicate the day of entrainment. (E) Group analysis of activity onset; F (1, 14) = 12.74; p = 0.0031, repeated-measures two-way ANOVA with Bonferroni post hoc comparison; n = 8–9/group; * p < 0.05, ** p < 0.01, *** p < 0.001. (F) Frequency of mice per number of days required to entrain wheel running activity to the new light cycle. (G) Group analysis of day 1 and day 2 cumulative phase shift; F (1, 15) = 7.056; p = 0.0180, repeated-measures two-way ANOVA with Bonferroni post hoc comparison; n = 8–9/group; ** p < 0.01. (H) Rate of entrainment calculated by the slope of activity onsets; repeated-measures two-way ANOVA with Bonferroni post hoc comparison; * p < 0.05. Data are represented as mean ± SEM. See also Figure S5 and Table S1.

