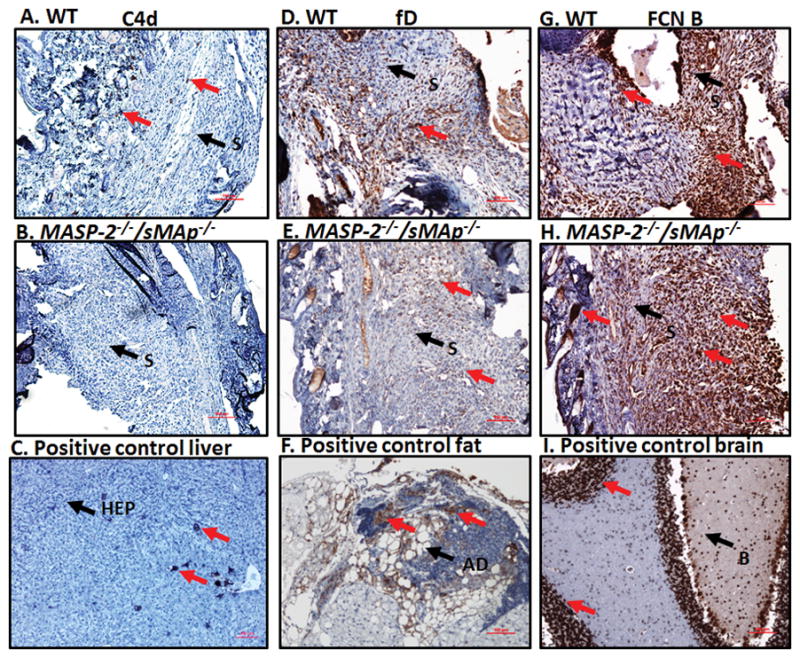
FIGURE 4.

Representative images of ankle joint synovial IHC for C4d, fD and FCN B deposition in WT and MASP-2−/− /sMAp −/− mice with CAIA. Specific area of the ankle synovium with maximum number of positive cell staining has been shown. All ankle joints from mice with CAIA were fixed in a 10% neutral buffered formalin, paraffin-embedded, and sectioned at a thickness of 5 μm followed by specific staining. The first set of three panels from top to bottom (A, B, & C) show staining with anti-C4d Ab (brown color) from the ankle joints of WT mice with CAIA (first left most panel), MASP-2−/− /sMAp −/− mice with CAIA (second left center panel) and a positive mouse liver control for C4d (last left bottom panel). The center set of three panels from top to bottom (D, E & F) show staining with mouse fD antibody (brown color) from the ankle joints of WT with CAIA (first center most panel), MASP-2−/− /sMAp −/− mice with CAIA (second center most panel) and a positive adipose tissue (fat) control for fD (bottom center most panel). The right set of three panels from top to bottom (G, H & I) show staining with mouse FCN B Ab (brown color) from the ankle joints of WT with CAIA (first right most panel), MASP-2−/− /sMAp −/− mice with CAIA (second right most panel) and a positive brain control for FCN B (last right most panel). Negative matched-isotype control sections from various tissues were also used with each staining method and there was no non-specific-staining as expected (data not shown). Specific areas of the synovium of the ankle and other tissues have been identified by black arrow (S-synovium), (Ad-adipose tissue), (HEP-hepatocyte), (B-brain), (GLOM-glomerulus) and (D-dermis). Specific staining (brown color) in each panel has been shown by red arrows. The ankle joint sections stained for C4d deposition, fD and FCN B were also counterstained with Hematoxylin (H) and photographed under the 10× objective using photographed under the 10× objective using Nikon® Eclipse 80i microscope equipped with Nikon® DS-Qi1MC camera. Red scale bar shown at the bottom right hand corner in images from A–I equals 0.1 mm (100 μm).
