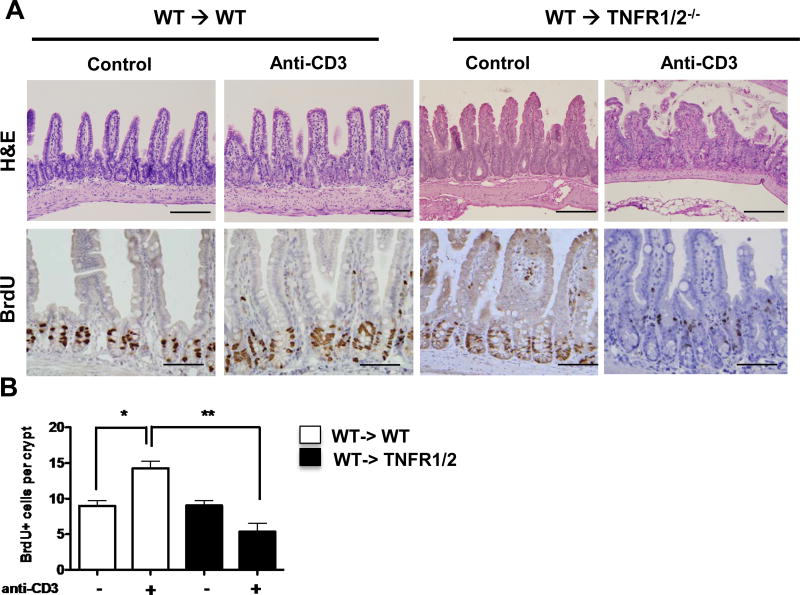
Figure 7. TNFR signaling mediates T cell-mediated IEC response.
(A) Representative images of H&E and BrdU staining for ileal tissue of control- and anti-CD3-treated bone marrow chimera mice. Scale bars represent 150µm. (B) Quantification of BrdU-positive cells per crypt. Positive cells were counted in at least 20 well-oriented crypt/villus axes per section; n=4 mice per group. Values represent mean ± SEM *p<0.01, **p<0.001.

