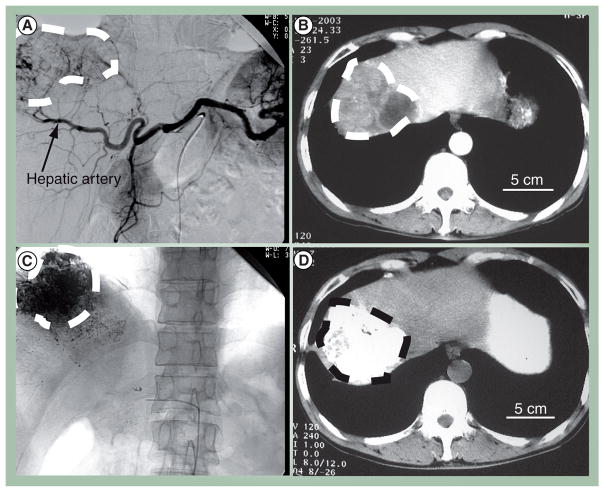
Figure 2. Pre- and peri-operative imaging for transarterial chemoembolization.
(A) Digital subtraction angiography image of the celiac trunk shows a hepatocellular carcinoma tumor and its (B) corresponding feeding vessel branches of the hepatic artery. Contrast enhanced computed tomography (CT) shows a hypodense tumor region in the right liver lobe. (C) After transarterial chemoembolization treatment, iodized lipiodol is shown to accumulate in the tumor mass with planar x-ray imaging and (D) in noncontrast CT. All tumor regions are encircled by the dashed line.
Images reproduced with permission from Huimin Liang, Huazhong University of Science and Technology, China.

