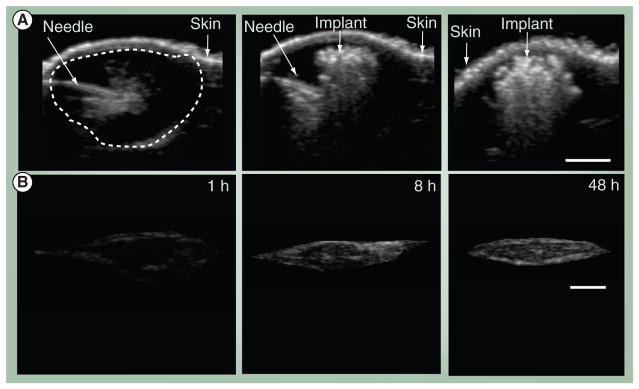
Figure 4. In vivo ultrasound imaging for the evaluation of implant formation.
(A) Ultrasound images of an intratumoral injection of a 64-kDa in situ forming polymer solution, immediately before the polymer is injected, immediately after the polymer is injected and 24 h after the implant is injected and (B) isolated gray scale images of the in vivo subcutaneous 30-kDa implants over time at: 1, 8 and 48 h after implantation. The arrows indicate the location of the needle within the tumor volume as well as identifies the skin, the dashed line surrounds the tumor volume.
The scale bar represents 0.25 cm.

