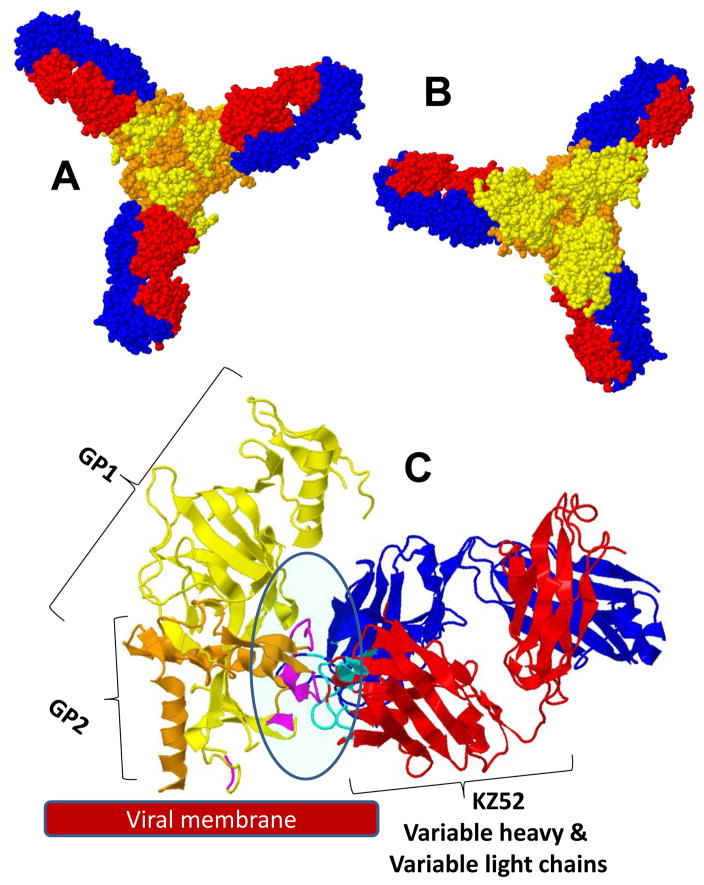
Figure 2.
3-D view of the complexity of three monoclonal antibodies binding to GP-EBOV, as resolved using X-ray crystallography (Lee et al., 2008; Lee et al., 2009): (A) bottom view (as seen from the viral surface). The GP1 subunit is colored in yellow; GP2 is colored in orange. In the case of mAb KZ52, only the FAB region is presented (variable light chains in blue; variable heavy chains in red). (B) Top view (the mucin-like domain is not presented).

