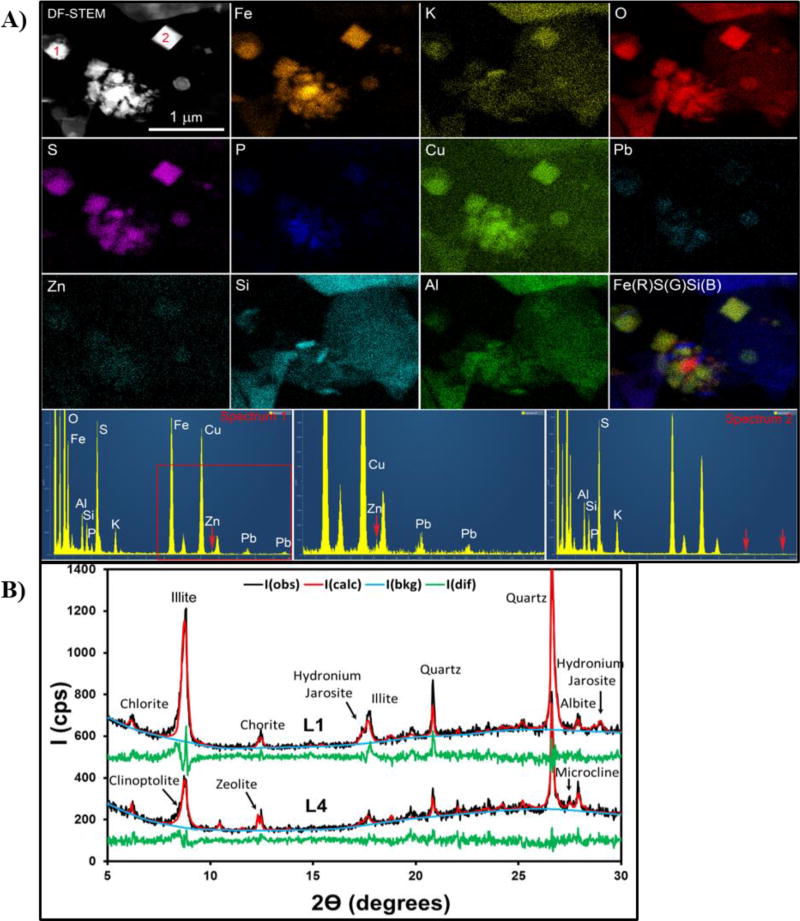
Figure 4.
Mineralogy of the sediments. Panel A shows the scanning transmission electron microscope (STEM) and STEM X-ray map data of crystals in sediment sample from Cement Creek, L1. Upper left image is a dark-field STEM image showing two submicron, euhedral crystals of jarosite (bright in the image and labeled as 1 and 2), associated with fine-grained, clay-rich material and Fe-oxyhydroxides (center part of the image). Additional images show STEM X-ray maps for Fe, K, O, S, P, Cu, Pb, Zn, Si and Al. The intensity of the color is correlated with the concentration of the element in the sample. The data show that in addition to the major elements, Fe, K, Cu, O, and S, the jarosite grain 1 also contain detectable concentrations of P, Pb and Zn, but they are not detected in jarosite grain 2. This data is supported by the EDS spectra presented in the bottom of the image. Panel B is the X-ray diffraction spectra of samples from Cement Creek, L1, and Baker’s Bridge, L4.

