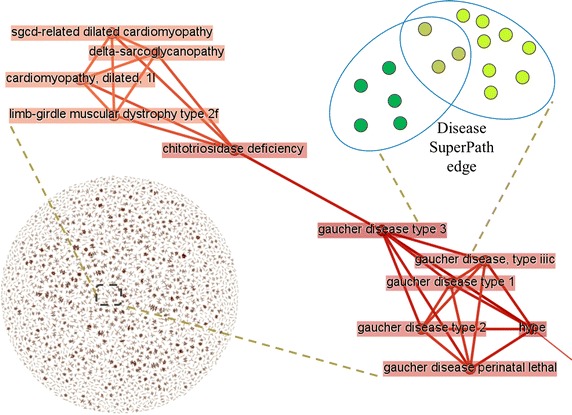
Fig. 6.

Disease SuperPaths are created by applying the PathCards biological pathway clustering algorithm to disease pathways, as explained in the text. Bottom left—the collection of all disease SuperPaths; Center—a specific disease SuperPath that appears to strongly represent Gaucher disease types, and diseases with related etiology. Each rectangular edge is a disease pathway, shown at the top right as an oval circumference, containing the disease genes that constitute the disease pathway. A connecting red line is an edge in the disease SuperPath, defined by gene sharing between the two disease pathways (genes shared by two ovals); The disease SuperPaths provide novel (indirect) disease–disease association, whereby two disease pathways that share no associated genes are linked to each other via the fact that there is a third disease pathway that shares gene with both (see text)
