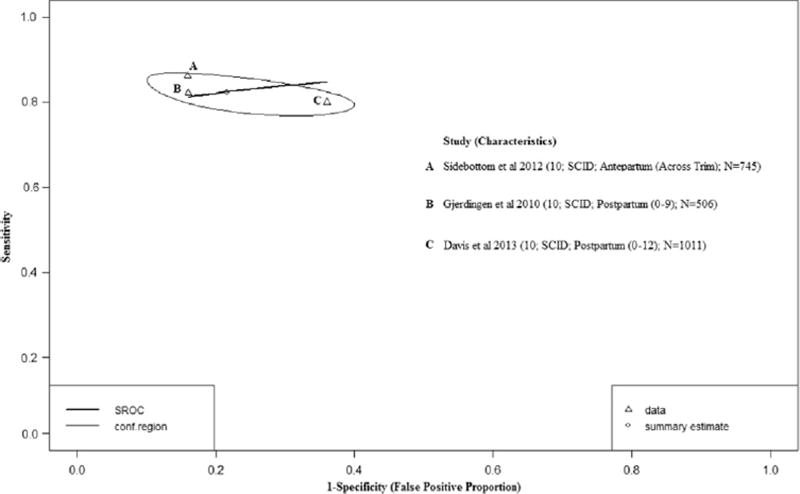
Fig. 5.
Hierarchical Summary Receiver Operator Curve (HSROC) plot for the PHQ9. Each open triangle represents each study in the meta-analysis. The curve is the regression line that summarizes the overall diagnostic accuracy. The pooled sensitivity and specificity estimate is based on the assumption of conditional independence and use of perfect reference standards.

