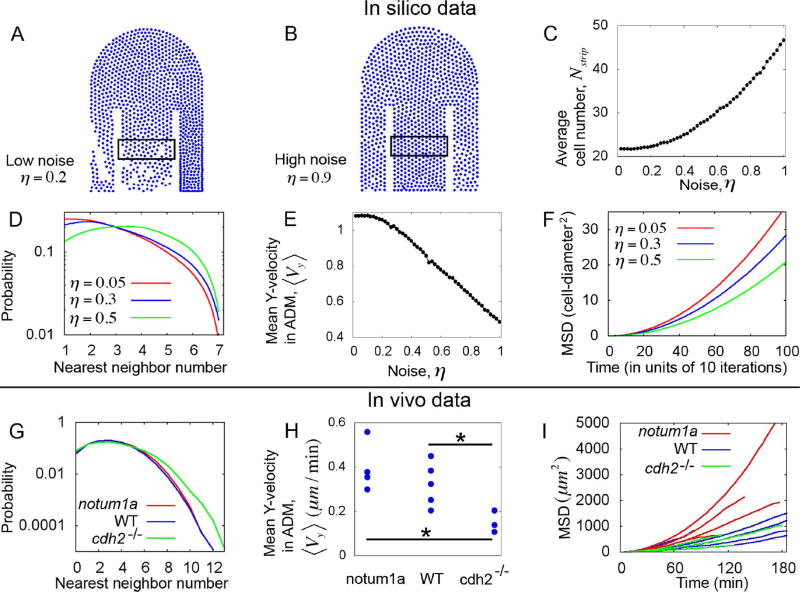
Figure 4. Excessive disorder in cell motion retards elongation.
(A–B) Simulation snapshots showing low cell density within the ADM at low noise (A), and high cell density at high noise (B). We quantified the cell number (Nstrip) inside the rectangular strips shown in figures A and B. (C) Nstrip increases with noise, indicating congestion. (D) In silico probability distribution of nearest neighbors inside the ADM for different values of noise parameters. (E) Average Y-velocities (posterior-components) per particle within the ADM. ⟨Vy⟩ decreases with increasing noise. (F) Mean square displacement (MSD) versus lag time (as calculated from the simulated tracks inside the ADM) for different values of noise. These simulations indicate that increasing disordered cell motion increases congestion and reduces effective posterior migration. In panels A-F the adhesion and repulsion parameters are Fadh =0.75, Frep =30, and a fixed rate of cell influx is maintained in the anterior ADM. Other parameters are as specified in the Experimental Procedures. (G) In vivo probability distribution of nearest neighbors for different phenotypes. These data show congestion in cdh2−/−. (H) Average posterior-components of velocities per cell. ⟨Vy⟩ shows the slowest ADM cell movement in cdh2−/−. Here, “*” denotes p-value <0.05 (T-test). (I) In vivo MSD (calculated from the cell tracks within the ADM) versus lag-time for each embryo of different phenotypes. These data show that disordered cell motion in the ADM of cdh2−/− leads to congestion and reduction of posterior cell movement. See also Figure S3.

