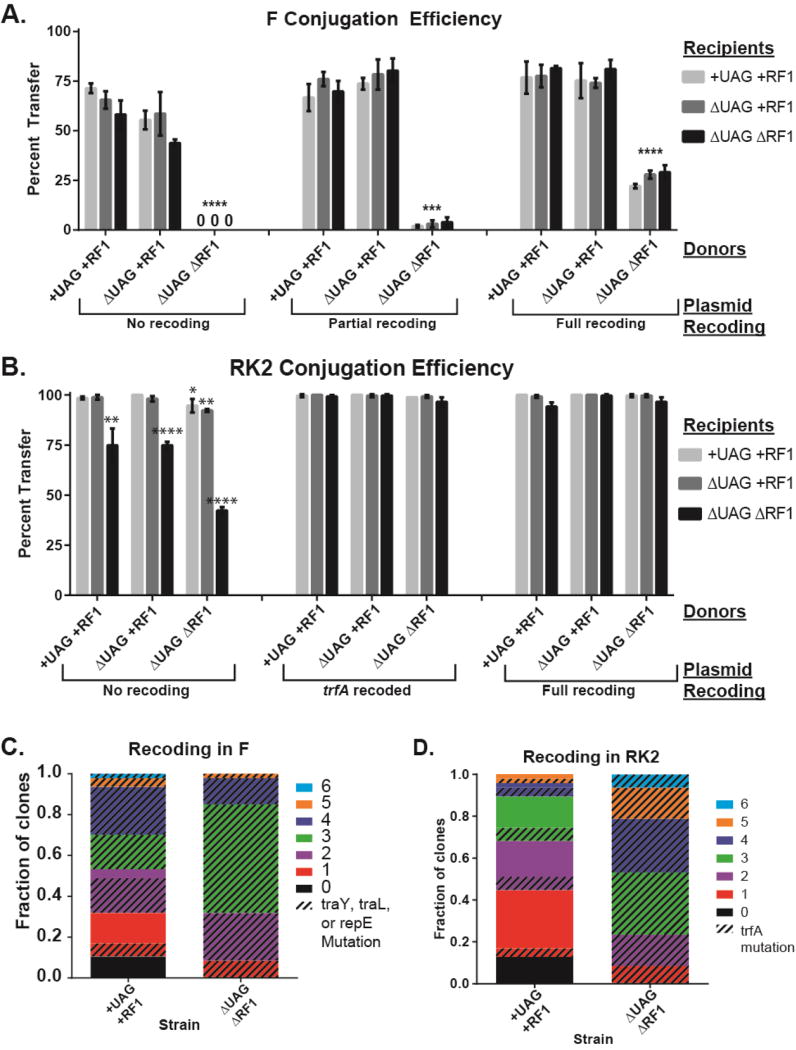
Figure 2. The alternate genetic code obstructs conjugation.
Conjugation efficiency from donors with standard and alternate genetic codes (x-axis) to recipients with standard and alternate genetic codes (bars) for wild-type and recoded (A) pF and (B) pRK2 conjugative plasmids. “0” indicates transfer efficiency was below limit of detection of 1%. Data are mean with standard deviation, n=3. P-values are as follows: * is P ≤ 0.05, ** is P ≤ 0.01, *** is P ≤ 0.001, and **** is P ≤ 0.0001. (C) Mutation analysis of 96 pF variants isolated after recoding using MAGE and conjugation from +UAG+RF1 and ΔUAGΔRF1. (D) Mutation analysis of 96 pRK2 variants isolated after recoding using MAGE and conjugation to +UAG+RF1 or ΔUAGΔRF1. For mutation analysis, colors represent number of mutations and pattern represents mutants with UAG-to-UAA recoding in indicated genes.

