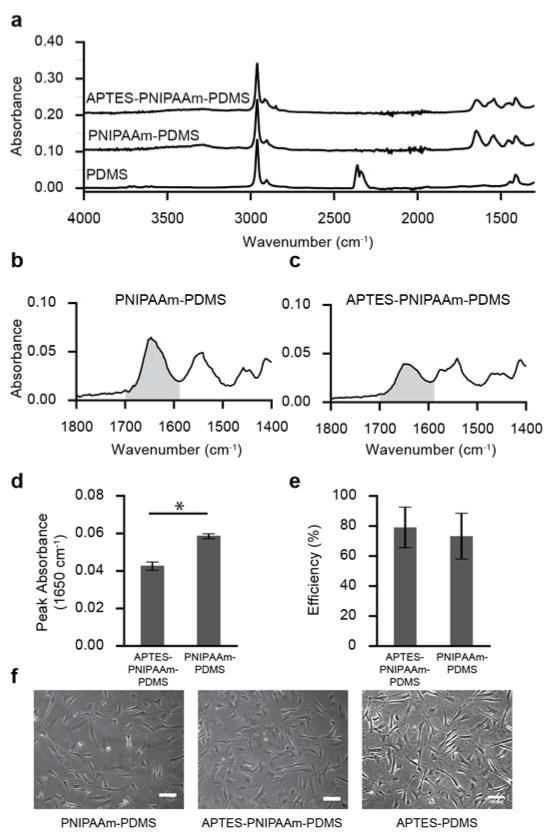
Figure 4.
Fourier transformed infrared spectroscopy and cell attachment efficiency for APTES-PNIPAAm-PDMS substrates. (a) FT-IR absorption spectra for PDMS, PNIPAAm-PDMS and APTES-PNIPAAm-PDMS substrates. (b) Absorbance spectra of the C=O stretching bond of an APTES-PNIPAAm-PDMS substrate. Grey region corresponds to wavenumbers where the area under the curve was calculated in panel e. (c) Absorbance spectra of the C=O stretching bond of an APTES-PNIPAAm-PDMS substrate. (d) Peak FT-IR absorbance of the 1650 cm−1 peak for PNIPAAm-PDMS and APTES-PNIPAAm-PDMS substrates (N=3). (e) Mean cell seeding efficiency (± s.d.) for VSMCs seeded onto PNIPAAm-PDMS and APTES-PNIPAAm-PDMS surfaces (N=3; p>0.05; t-test). (f) VSMC attachment on PNIPAAm-PDMS APTES-PDMS and PNIPAAm-APTES-PDMS substrates 18 hours after seeding substrates with 15k cells cm−2.

