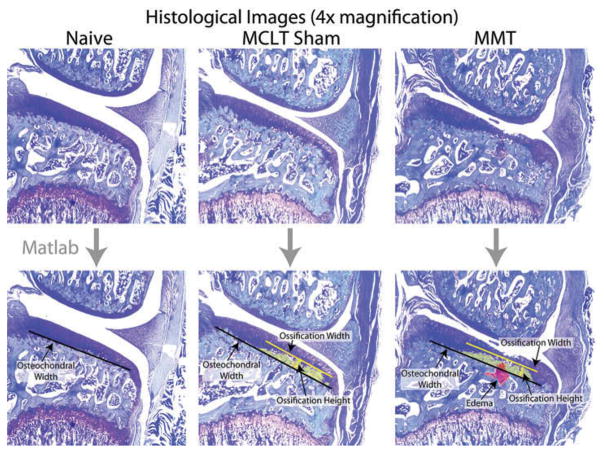
Figure 1.
Summary of MATLAB script to measure changes at the subchondral bone-cartilage interface following a simulated meniscus injury in the rat. Once loaded, users place markers defining osteochondral width by clicking the two end points defining the measure (black line). If present, the user then outlines any edemas (red) or ossification (yellow) present in the subchondral bone using a series of clicks.

