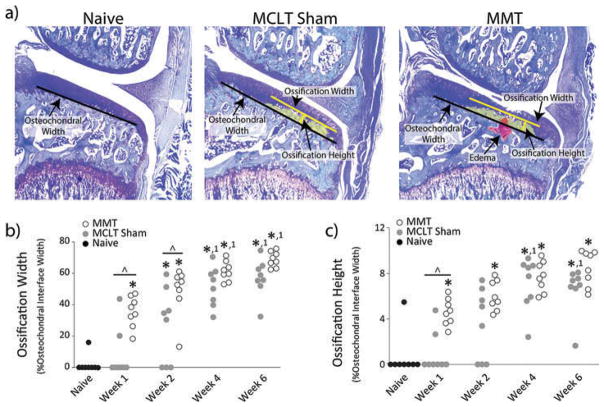
Figure 4.
Ossification of Subchondral Bone. a) Representative toluidine blue-stained images from naïve, MCLT sham, and MMT groups. b) and c) Ossification occurs in both MMT and MCLT Sham animals and becomes progressively more severe. Data are shown as animal averages. * denotes significance from naïve; ^ denotes significance from MCLT Sham values at respective time point; 1 denotes significance from respective group at week 1 post-surgery.

