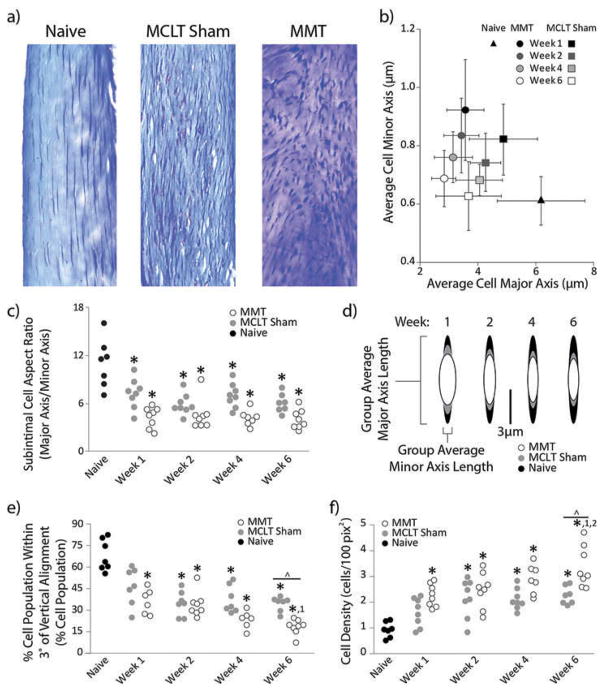
Figure 7.
Subintimal cell morphology. a) Representative cropped and rotated histological images of synovium stained with toluidine blue. b) Group averages and standard deviations of cell minor axis plotted against cell major axis. In MMT animals, minor axis measures increase and major axis measures decrease. There is also a trend for the major axis to progressively reduce across time points. c) MMT and MCLT sham animal subintimal cell aspect ratio are lower than naïve animals at all time points. d) Graphical representation of cell shape from group averages of major and minor axis length at each time point. e) Progressively lower percentages of subintimal cell population are aligned in both MMT and MCLT Sham animals. f) Cell proliferation, indirectly measured as cell density, increased progressively in both MMT and MCLT Sham groups, though the effect in MMT animals was more significant than MCLT Sham animals by week 6 post-surgery. Data are shown as animal averages. * denotes significance from naïve; ^ denotes significance from MCLT Sham values at respective time point; 1 denotes significance from respective group at week 1 post-surgery; 2 denotes significance from respective group at week 2 post-surgery.

