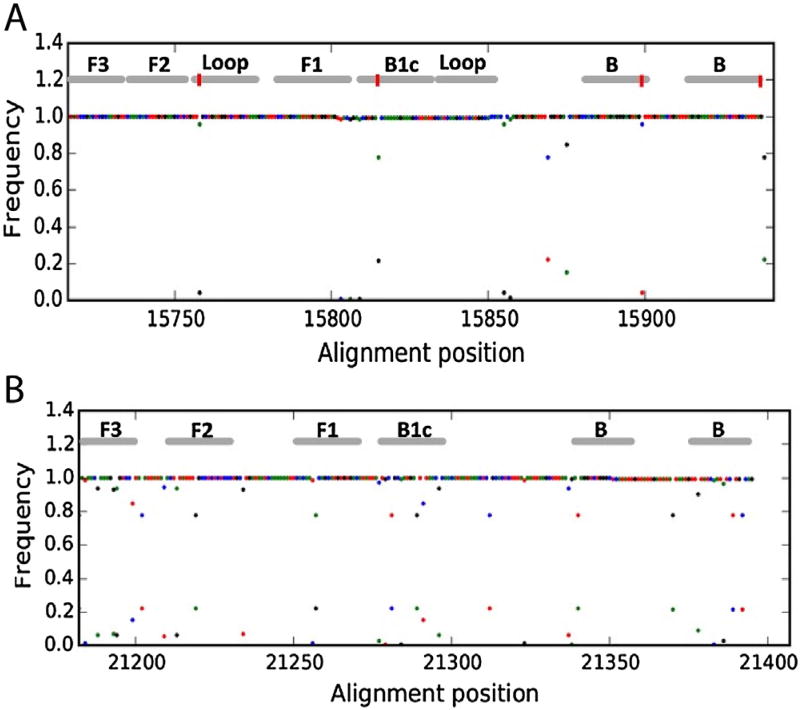
Fig. 1. ZEBOV RT-LAMP target region.
Positional nucleotide frequency in an alignment of 143 ZEBOV isolates is demonstrated on the y axis. Points are color coded, where green = A, red = T, black = G, and blue = C. The regions targeted by RT-LAMP oligonucleotides in the present study (A) and in a previously reported ZEBOV RT-LAMP assay (B) are depicted at the top of the plot. Red bars in panel A indicate the sites on inosine incorporation.

