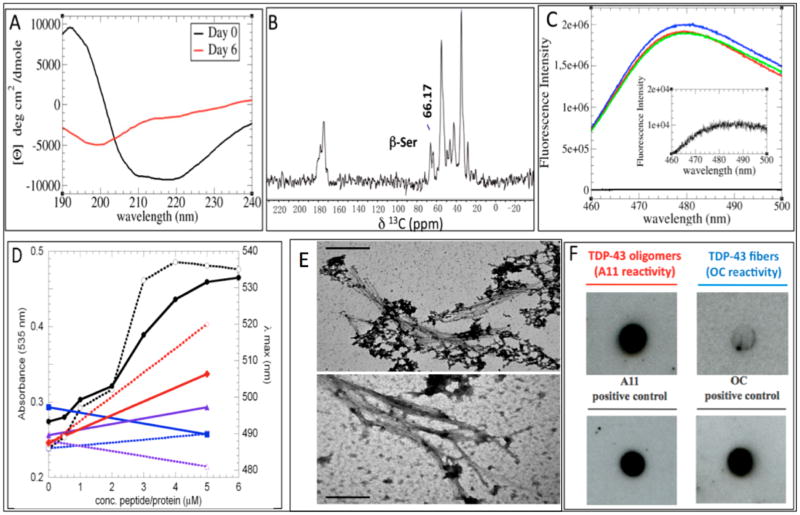
Figure 1.
(A) CD spectra of a TDP-43(341–357), contrasting freshly dissolved samples (black line) with samples aged for 6 days (red line); an enrichment of β-secondary structure content occurs. (B) 13C ssNMR spectrum; a peak arising from a Ser 13Cβ atom in a β-conformation is indicated. (C) ThT fluorescence assay of three different samples (blue, red, and green curves) with a blank (black line) magnified, indicating the presence of amyloid structures. (D) Congo Red absorbance at 535 nm (solid symbols, solid lines, left y axis) and absorbance maxima (open symbols, dotted lines, right y axis) in the presence of TDP-43(341–357) (black circles), RNase A (blue squares), KIAβW (purple triangles), and Aβ1–40 (red diamonds). (E) Representative TEM micrograph shows lateral association of TDP-43(341–357) aggregates (top) that resemble those formed by expanded PolyQ (Q62) segments (bottom). The bar scale in both cases is 0.2 μm. (F) Antibody A11 recognizes TDP-43(341–357), which is consistent with the formation of smaller amyloid-like oligomers; in contrast, the OC antibody (specific for amyloid-like fibrils) shows weak/negligible binding. Prefibrillar oligomers and fibrillar species of Aβ1–42 were used as positive controls for A11 and OC reactivity, respectively.

