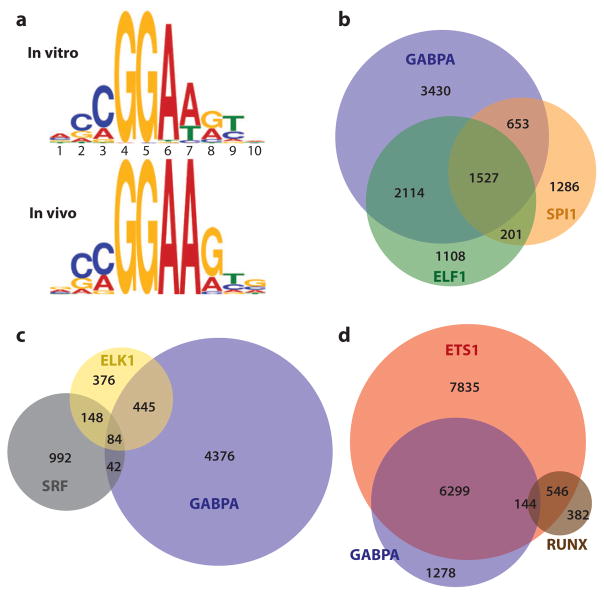
Figure 6.
Genomic analyses via ChIP-chip and ChIP-Seq detect specific and redundant ETS binding. (a) Redundantly occupied regions in cells have a DNA sequence similar to preferred ETS-binding sequences derived in vitro. Sequence frequencies are compiled (top) from all 27 in vitro–derived ETS-binding sites (62) or (bottom) from the most overrepresented sequence in regions co-occupied in cells by GABPA, ETS1, and ELF1 (62, 65, 136). Frequencies are shown in logo form, which depicts base pair (A:T, T:A, G:C, C:G) frequency as relative heights of A, T, G, and C, respectively. (b) Redundant occupancy is observed for even the most divergent family members and between species. The relative distribution of specific and overlapping bound regions are shown for GABPA (136) and ELF1 (62) in human Jurkat T cells and SPI1 in mouse macrophages (138) by numbers of bound regions within a Venn diagram display. Analysis of SPI1 mouse data was limited to promoter regions, which could be compared with orthologous human regions using the LiftOver tool at http://genome.UCSC.edu (235). Data were reprocessed for this comparison, as previously reported (65). (c,d) Serum response factor (SRF) and RUNX preferentially co-occupy regions bound specifically by ELK1 and ETS1, respectively. Diagrams (c,d) illustrate data from Boros et al. (134) and Hollenhorst et al. (65), respectively. See Supplemental Table 4 for database sources of all genomics data.

