
Figure 2. Active and Inactive Alpha Satellite Arrays Are Transcribed.
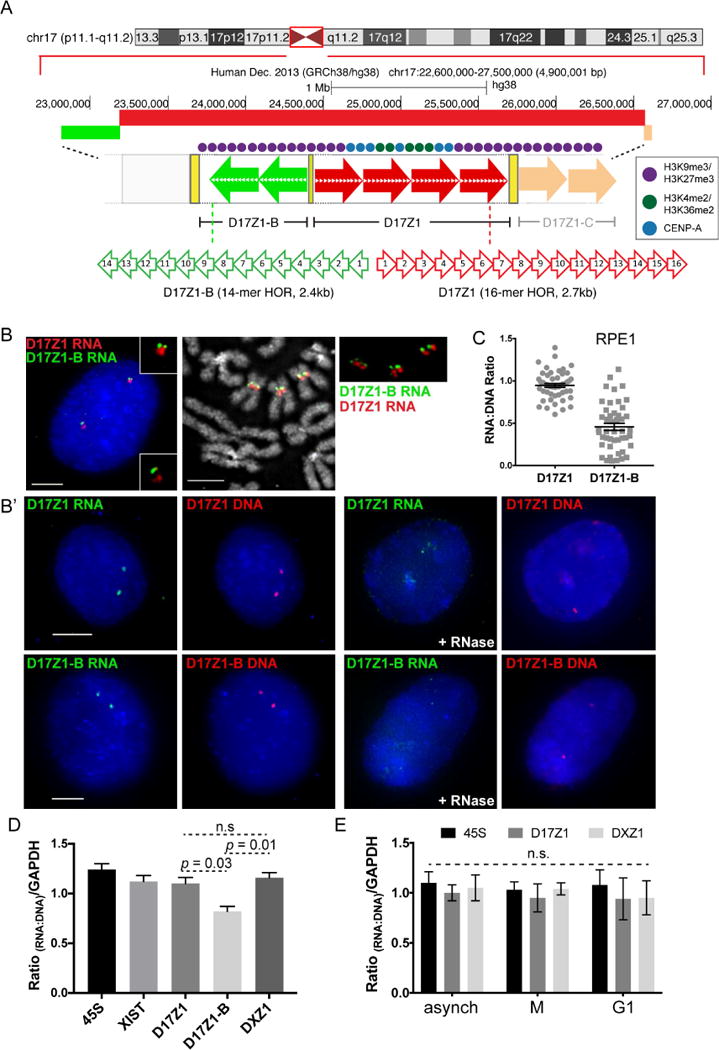
(A) HSA17 has three distinct alpha satellite arrays; either D17Z1 (red arrows) or D17Z1-B (green arrows) can be the active centromere.
(B, B′) In RPE1, D17Z1 is active on both HSA17s. RNA FISH with D17Z1 (red) and D17Z1-B (green) HOR probes on interphase cells and metaphase chromosomes (B) and RNA-DNA FISH in interphase cells (B′). RNase treatment verified detection of RNA. Bars, 5μm.
(C) Dot plots of RNA:DNA ratios of D17Z1 and D17Z1-B from RNA-DNA FISH in (B′) (mean ± SEM).
(D) RT-qPCR of D17Z1, D17Z1-B, and DXZ1 RNA in RPE1 cells relative to qPCR of gDNA of same array. 45S rRNA and XIST lncRNA relative to gDNA are shown for comparison (mean ± SEM). Data represent two biological replicates that each contained three technical replicates.
(E) RT-qPCR of D17Z1 and DXZ1 transcripts from synchronized RPE1 cells (mean ± SEM). No significant differences in RNA:DNA ratios were observed at D17Z1 or DXZ1 across the cell cycle. Data in this figure were statistically analyzed using a t-test. See also Figures S1–S3.