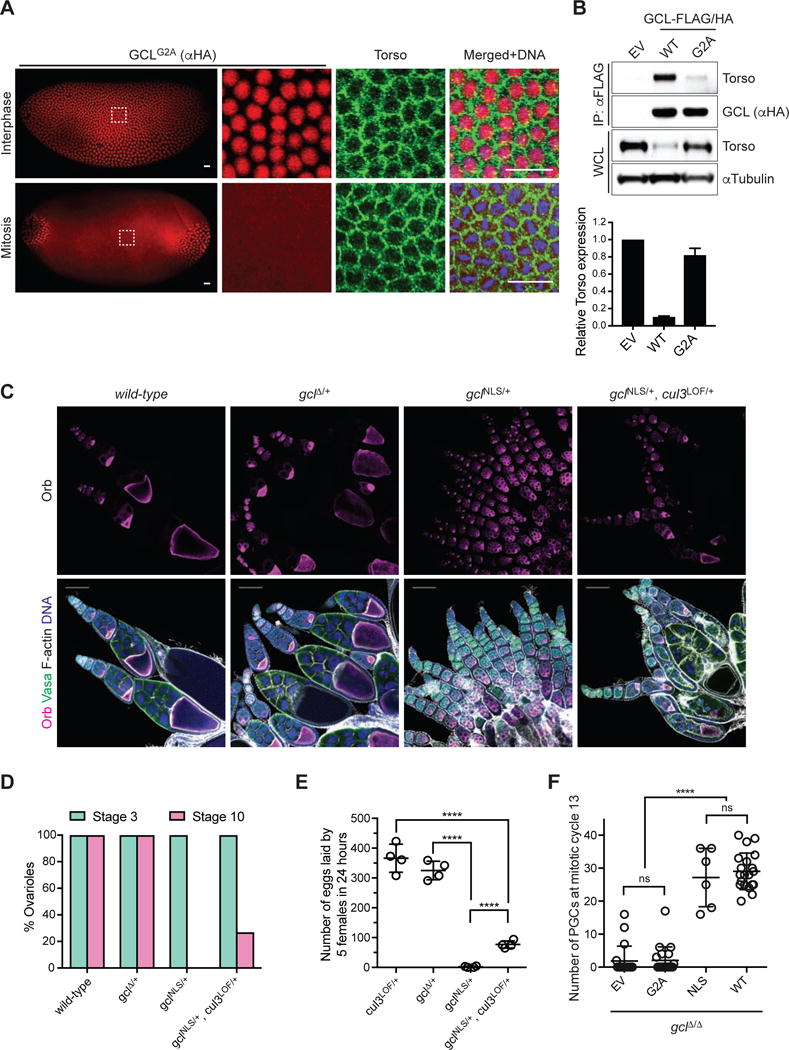
Figure 7. Disruption of the nuclear localization signal in GCL results in gain-of-function defects in oogenesis.

(A) Immunofluorescence analysis in embryos expressing FLAG-HA-tagged GCLG2A with antibodies recognizing HA (red) and Torso (green). DNA (blue) was used to determine the cell cycle stage of each embryo. Scale bar = 20μm. GCL transgenes, generated with UAS promoter and the k10 3′UTR regulatory sequence, were expressed using the germline-specific driver maternal tubulinGAL4∷VP16. Embryos during nuclear cycle 12–13.
(B) (Top) Lysates prepared from 0–2 hours AEL embryos expressing either empty vector (EV) or a FLAG-HA-tagged GCL variant (WT or G2A) using the UAS-GAL4 system were immunoprecipitated (IP) with anti-FLAG resin. Immunocomplexes were probed with antibodies specific to the indicated endogenous proteins. (Bottom) Densitometric scanning quantification of the Torso expression levels in the embryo lysates relative to the corresponding αTubulin (loading control) levels. The averaged relative Torso expression levels from triplicate experiments are plotted with respect to the EV control. Error bars represent standard deviation.
(C) Fixed ovarioles of indicated genotype were immunostained with anti-Orb (magenta), which marks an oocyte in each egg chamber, and Vasa (green). DNA (blue), F-actin (grey). Wild-type (w−1118) ovarioles are used as controls. Images are representative of at least 100 ovarioles analyzed per genotype. Scale bar = 100μm.
(D) Percentage of ovarioles with early stage (Stage 3, green) or late stage (Stage 10, magenta) egg chambers was scored for the ovarioles of indicated genotype. At least 100 ovarioles analyzed per genotype.
(E) Number of eggs laid by 5 females of indicated genotype was counted over the course of 24 hours to assess their fertility. Each circle represents a biological replicate. (****P < 0.0001, Mann-Whitney test)
(F) Number of PGCs in embryos of indicated maternal genotype. Bars represent the mean ± standard deviation. (n=20 for each genotype, except for ΔNLS, ****P < 0.0001, ns=not significant, Mann-Whitney test)
