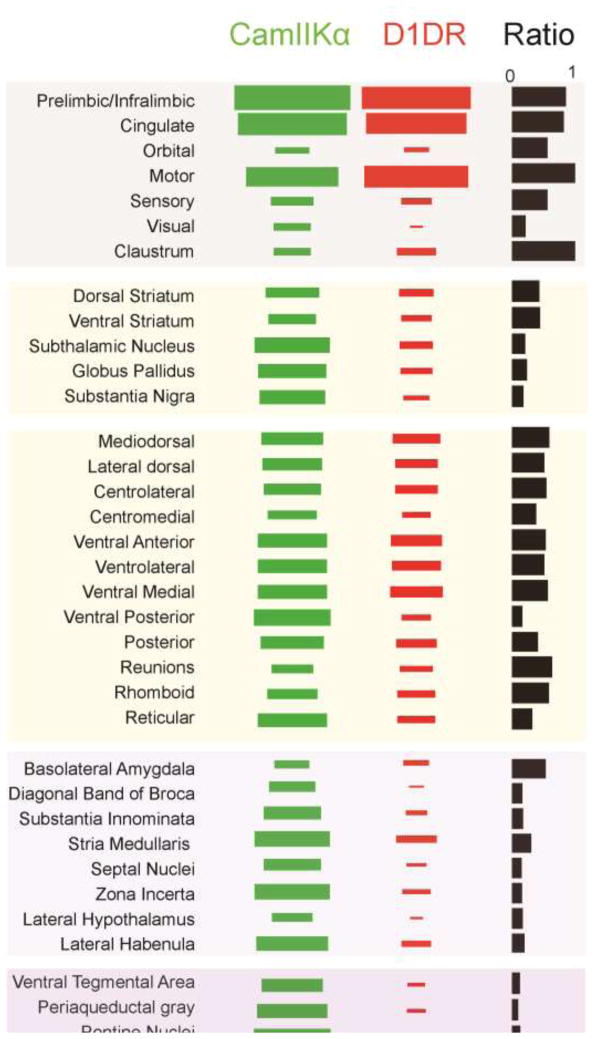
Figure 4. MFC D1DR+ projectome.
Hinton plots of relative projection strength in 4 mouse for MFC-CamKIIα+ (green) and MFC-D1DR+ (red). The third column indicates the ratio of MFC-D1DR+ to CamKIIα+ projections. For instance, there was the same amount of D1DR+/CamKIIα+ projections medial frontal, motor and sensory cortices, but D1DR+ projections to visual cortex was 0.4 times as strong as CaMKIIα+, and D1DR+ projections to the periaqueductal gray were 0.1 times as strong as CaMKIIα+.

