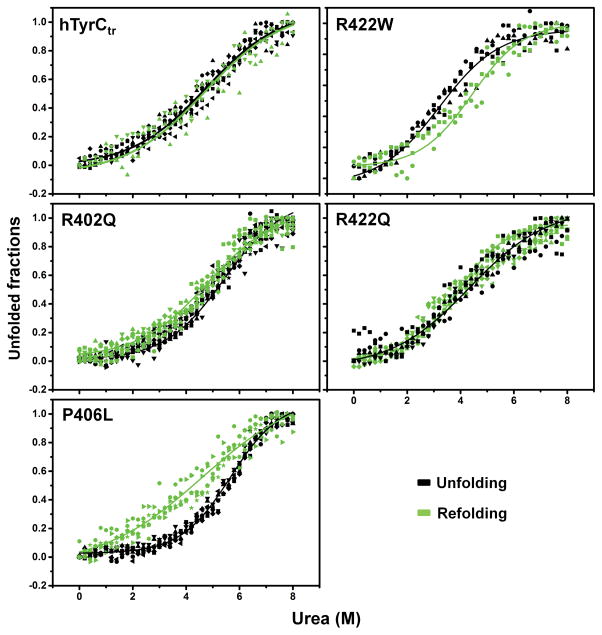
Figure 4. Urea-induced equilibrium unfolding/refolding of hTyrCtr and OCA1B-related mutants.
Intrinsic tryptophan fluorescence was measured using an excitation wavelength of 285 nm. Emission spectra were recorded in the range between 300 and 400 nm. Proteins (10 μM) were in 10 mM phosphate buffer, pH 7.4 with 0–8 M urea. For refolding, proteins were dialyzed against 10 mM phosphate buffer, pH 7.4 at 4°C for 24 h. Unfolding and refolding curves were measured as a 360/320 nm ratio and indicated by black and green points, respectively. To visualize the unfolding/refolding the experimental points were fitted with a Boltzmann function using OriginPro 2015 as indicated by black and green lines for unfolding and refolding, respectively.

