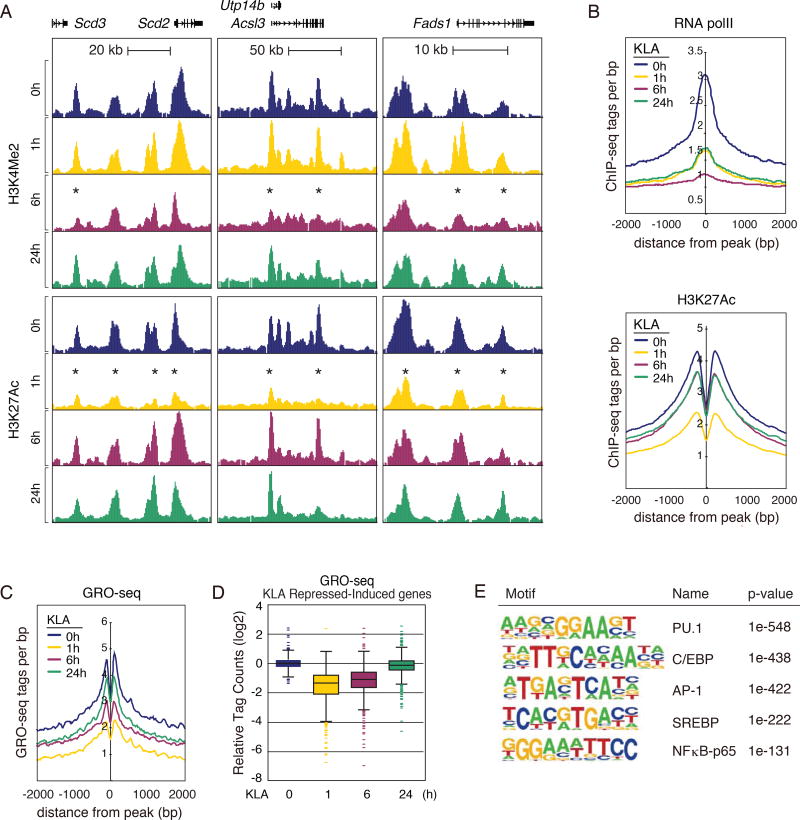
Figure 3. Temporal dynamics of cis-reglatory elements associated with KLA repressed-induced genes.
A. UCSC genome browser images illustrating normalized tag counts for H3K4Me2 and H3K27Ac, at the LXR target genes in bone marrow-derived macrophages treated with KLA for 0, 1, 6 and 24 hours.
B. Distribution of RNA Pol II and H3K27Ac tag densities in vicinity of KLA repressed-induced enhancers in bone marrow-derived macrophages treated with KLA for 0, 1, 6, 24 hours.
C. Distribution of GRO-Seq tags at KLA repressed-induced enhancers in thioglycollate-elicited macrophages treated with KLA for 0, 1, 6, 24 hours.
D. Relative distribution of GRO-Seq tags at gene bodies of KLA repressed-induced genes in thioglycollate-elicited macrophages treated with KLA for 0, 1, 6, 24 hours.
E. Sequence motifs enriched at enhancers associated with KLA repressed-induced genes.

