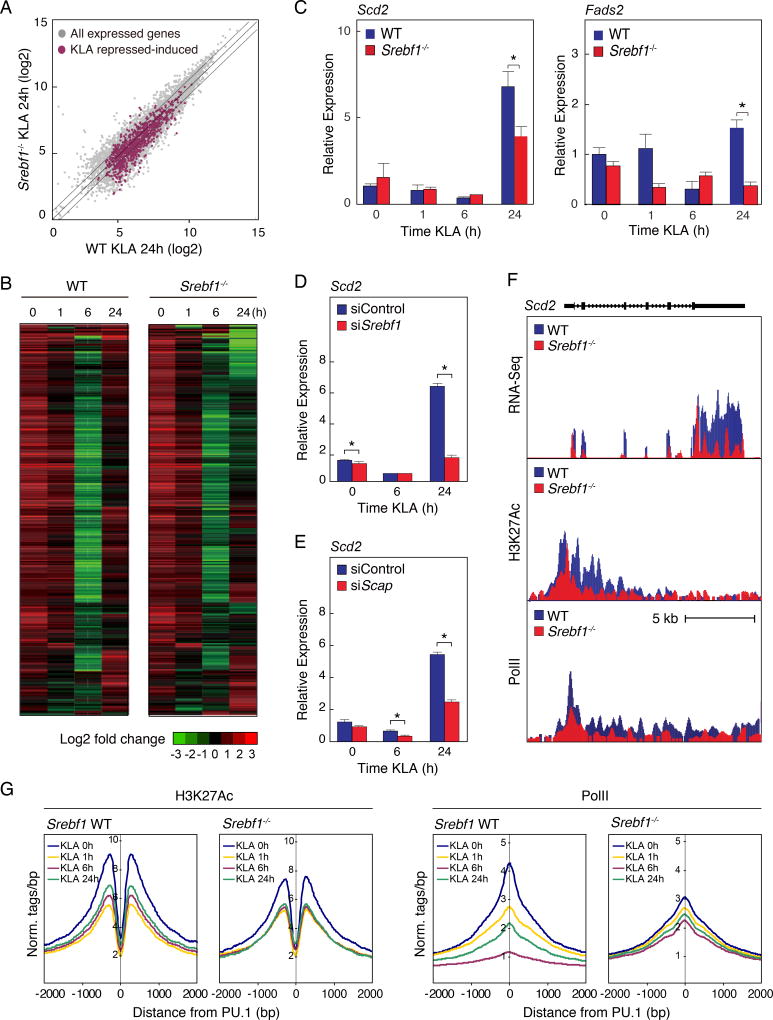
Figure 5. Srebf1−/− macrophages exhibit reduced fatty acid biosynthetic gene expression during the resolution phase of the TLR4 response.
A. Scatter plot depicting the relationship between fold change of KLA repressed-induced genes, comparing RNA-seq from wild-type (WT) versus Srebf1−/− bone marrow-derived macrophages treated with KLA for 24 hours. Gray dots show all expressed genes. Red dots represent all KLA repressed-induced genes.
B. Hierarchical clustering and heatmap of the fold change in expression levels of KLA repressed-induced genes in WT and Srebf1−/− bone marrow-derived macrophages treated with KLA for the indicated times (FDR < 0.01, RPKM > 0.5).
C. Relative mRNA expression of Scd2 and Fads2 in WT and Srebf1−/− bone marrow-derived macrophages treated with KLA for the indicated times.
D. Relative mRNA expression of Scd2 mRNA KLA-treated thioglycollate-elicited macrophages, transfected with siRNA control or targeting Srebf1.
E. Relative mRNA expression of Scd2 mRNA KLA-treated thioglycollate-elicited macrophages, transfected with siRNA control or targeting Scap.
F. Distribution of RNA-Seq, H3K27ac and RNA Pol II tag densities at the Scd2 locus in WT and Srebf1−/− bone marrow-derived macrophages treated with KLA for 24 hours.
G. Distribution of H3K27Ac and RNA Pol II tag densities in the vicinity of enhancers associated with KLA repressed-induced genes in WT and Srebf1−/− bone marrow-derived macrophages treated with KLA for the indicated times.
Values are expressed as mean ± SEM. *p<0.05, **p<0.01.
See also Figure S4.

