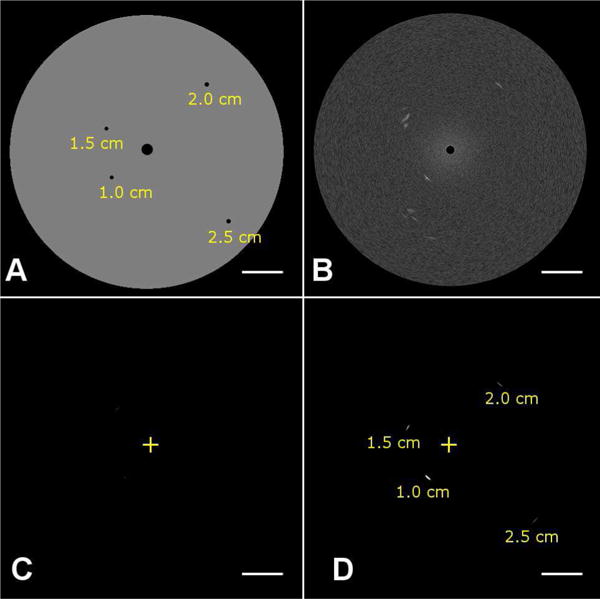
Fig. 6.

Phantom and imaging data used for assessing CTR as a function of varying depth with the developed transducer. (A) A tissue-mimicking phantom having attenuation of 0.4 dB/cm/MHz was imaged in (B) B-mode (transmit and receive 20 MHz), (C) dual-frequency mode before the injection of microbubbles (transmit: 4 MHz, receive: 20 MHz), and (D) dual-frequency mode after the injection of microbubbles. The ‘+’ indicates the transducer position. Depths of wall-less channels containing microbubbles are indicated in (A) and (D).
