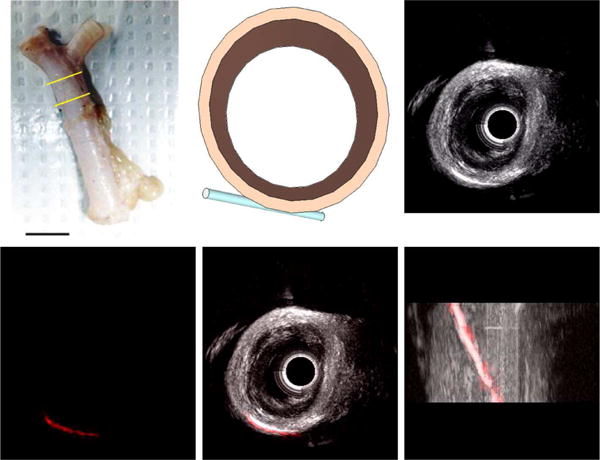
Fig. 8.

(A) Ex vivo porcine splenic artery specimen used for imaging experiments, with the imaged section indicated by yellow bars. Scale bar represents 1 cm. (B) Schematic of ex vivo artery section and cellulose tube filled with microbubbles for imaging experiment. (C) 3D rendering of B-mode (20 MHz) image acquired in arterial section (Scale bar = 2 mm). (D) 3D rendering of dual-frequency (transmit 4 MHz, receive 20 MHz) image of microbubbles in tube acquired in arterial section. Combined 3D rendering of B-mode (grayscale) and dual-frequency (red) imaging volumes shows contrast-specific signal originates only from microbubbles within the tube in (E) short and (F) long-axis views (Scale bar = 2 mm).
