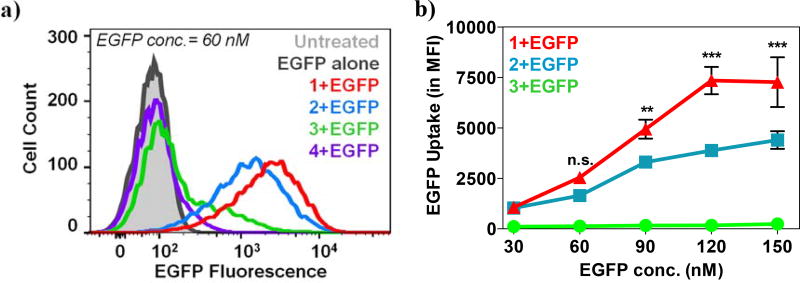
Figure 3. EGFP delivery into Jurkat T cells.
a) Representative overlay of histograms obtained from flow cytometric analysis showing different degrees of EGFP internalization into Jurkat T cells mediated by PTDMs 1–4 (60nM EGFP; 20/1 molar ratio PTDM/EGFP). b) Protein uptake per cell expressed as MFI after 4 h treatment of Jurkat T cells with increasing concentration of PTDM/EGFP complex (PTDM/EGFP molar ratio was held constant at 20/1). Data points represent mean ± SEM (standard error of mean) of at least three independent experiments. n.s.(p>0.05), **(p<0.01), ***(p<0.0001) of PTDM 1 vs. PTDM 2, as calculated by two-way ANOVA followed by Bonferroni post-test.

