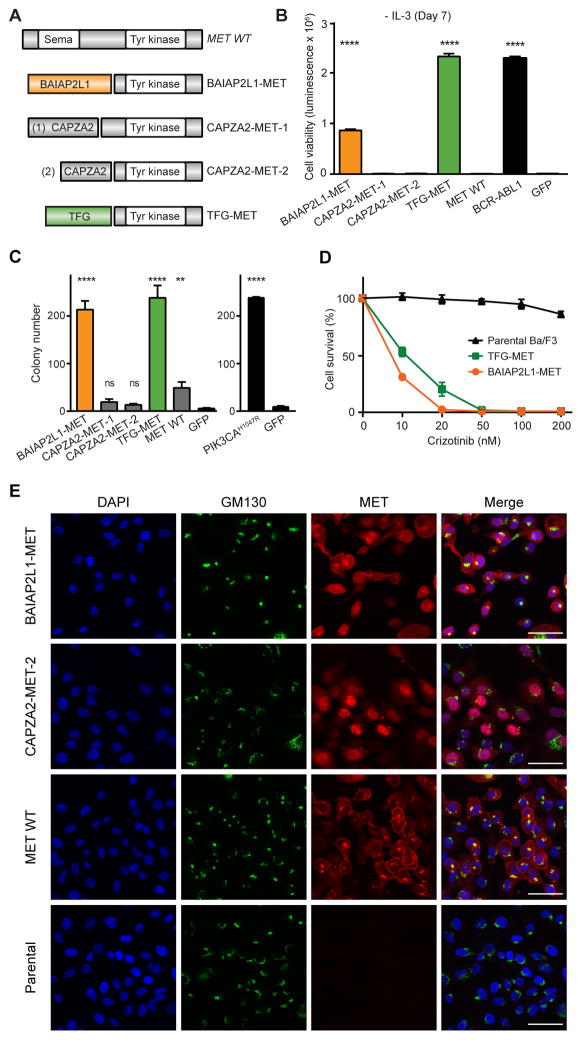
Figure 2. Oncogenic validation of MET fusions.
(A) Schematic illustration of MET fusion genes. (B) Ba/F3 cell survival assay for MET fusions (mean luminescence, error bars denote standard deviation, N=3) compared to positive control, BCR-ABL1, GFP = negative control. (C) MCF-10A anchorage-independent colony formation assays for all MET fusions (mean colony count from 10 random areas, error bars denote standard deviation, N=3). PIK3CAH1047R = positive control; GFP = negative control. (D) Dose-dependent survival assays of Ba/F3 cells expressing BAIAP2L1-MET and TFG-MET treated with crizotinib for 72 hours (mean percentage of cell survival, error bars denote standard deviation, N=4). (E) MCF-10A cells expressing BAIAP2L1-MET, CAPZA2-MET-2, wild-type MET, and parental were immunostained for MET (red) and Golgi body marker GM130 (green). DNA was labeled with DAPI. Scale bar: 50μM. All p-values calculated by t-test; ns, not significant; **, p<0.01; ****, p<0.0001.

