Figure 3.
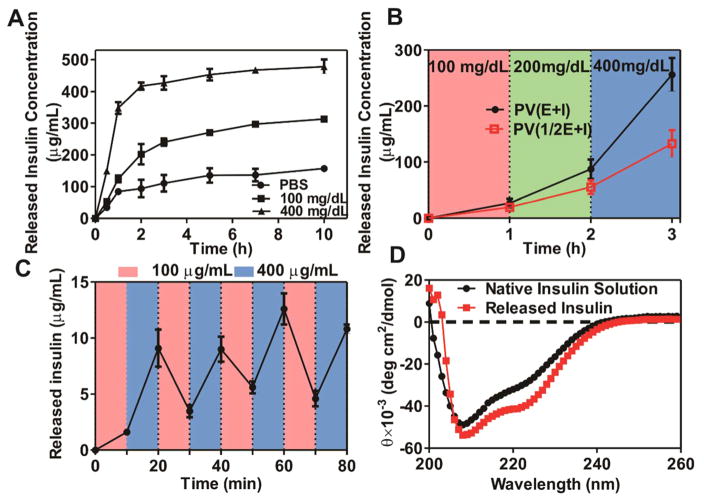
In vitro glucose-responsive release of insulin from PVs. (A) In vitro released insulin concentration from PVs(E+I) at several glucose concentrations at 37 °C; (B) The release rate (line slope) of insulin as a function of glucose concentration in the release media for PV(E+I) and [PV(1/2E+I) (containing one-half amount of GOx compared to PV(E+I)]; (C) Pulsatile release profile of insulin from PV(E+I) when the glucose concentration changed between 100 and 400 mg/dL alternatively for 10 min each; (D) CD spectra of native insulin solution and insulin released from the PVs incubated with 400 mg/mL glucose. Error bars indicate SD (n = 3).

