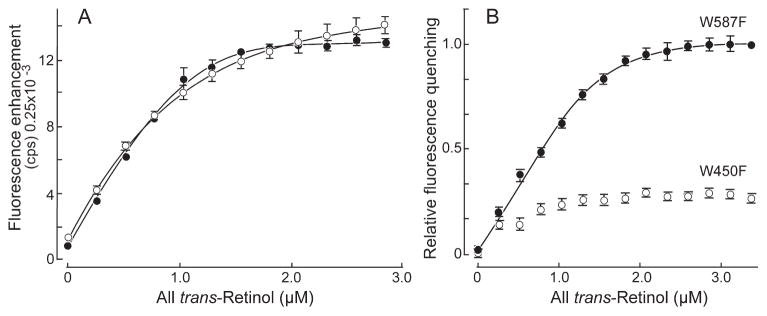
Figure 5.
Fluorescence titration of all-trans retinol binding to W450T and W587T X2IRBPs. The concentration of W450F (○) and W587F (●) were 1.0 and 0.80 μM, respectively. (A) Enhancement of retinol fluorescence (excitation at 330 nm, emission at 480 nm). (B) Quenching of tryptophan fluorescence (excitation 280 nm, emission 340 nm). The y-axis corresponds to the normalized fluorescence intensity relative to the maximum amount of quenching. Error bars are SEM for three independent titrations. The curves represent nonlinear least-squares fit of the data to the ligand-binding equation (coefficient of determination, R2 = 0.9996 for each of the curve fittings). These titrations represent protein from separate expressions and purifications from that used in the previous figure. W450F did not support sufficient quenching to allow meaningful fitting of the binding equation. Calculated number of binding sites and dissociation constants are summarized in Table 1.

