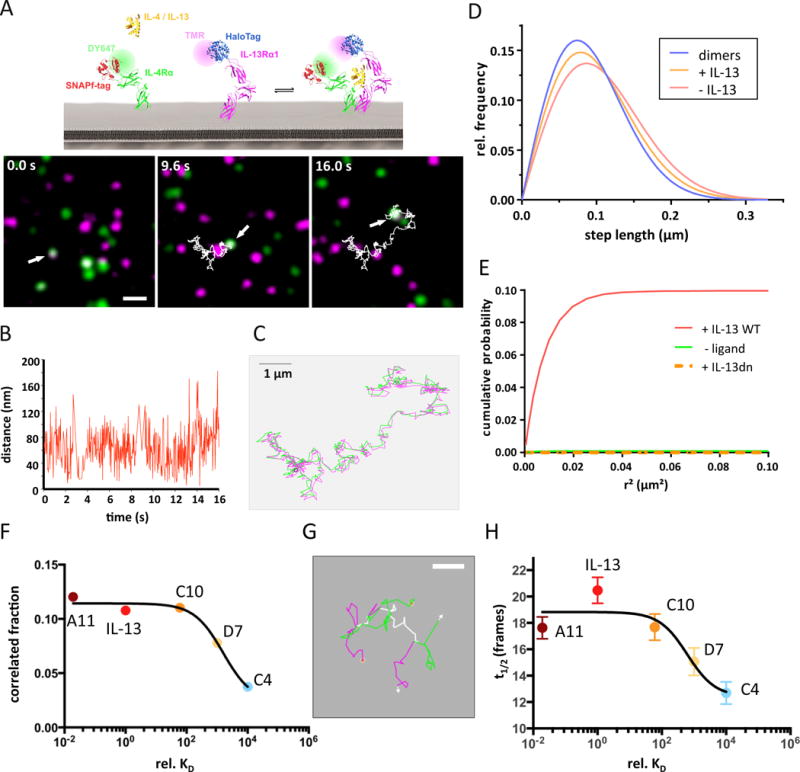
Figure 4. Assembly and dynamics of the ternary complexes formed by IL-13 agonists.

(A–C) IL-13 receptor dimerization detected by dual color single molecule imaging and co-locomotion-analysis. Images identifying an individual IL-13Rα1/IL-4Rα dimer in the presence of 200 nM IL-13 at different time points of a 500 frame (16 s) movie (A), the distance between the two molecules in each frame (B) and an overlay of the individual trajectories of IL-13Rα1 (magenta) and IL-4Rα (green) (C) are presented. Scale bars: 1μm in panels A and C. (D) Diffusion properties represented as step length distribution obtained for IL-13Rα1 in the absence (red) and presence (orange) of IL-13. For comparison, the step length distribution obtained for receptor dimers identified by co-locomotion analysis is shown (blue). (E) Cumulative probability of detecting an IL-13Rα1 molecule in the vicinity of an IL-4Rα molecule as a function of the squared distance, corrected for the statistical probability, in the presence and absence of IL-13 wt. For comparison, the cumulative correlation probability obtained in the presence of IL-13 DN is shown. (F) Correlation fraction for the IL-13Rα1 and IL-4Rα receptor subunit as a function of IL-13 agonist affinity. (G) Assembly and dissociation of an individual IL-13Rα1/IL-4Rα dimer in presence of agonist D7. Overlaying trajectories are shown in white. Scale bar 0.5 μm. (H) Average lifetime of the IL-13Rα1/IL-4Rα dimer as a function of agonist affinity.
