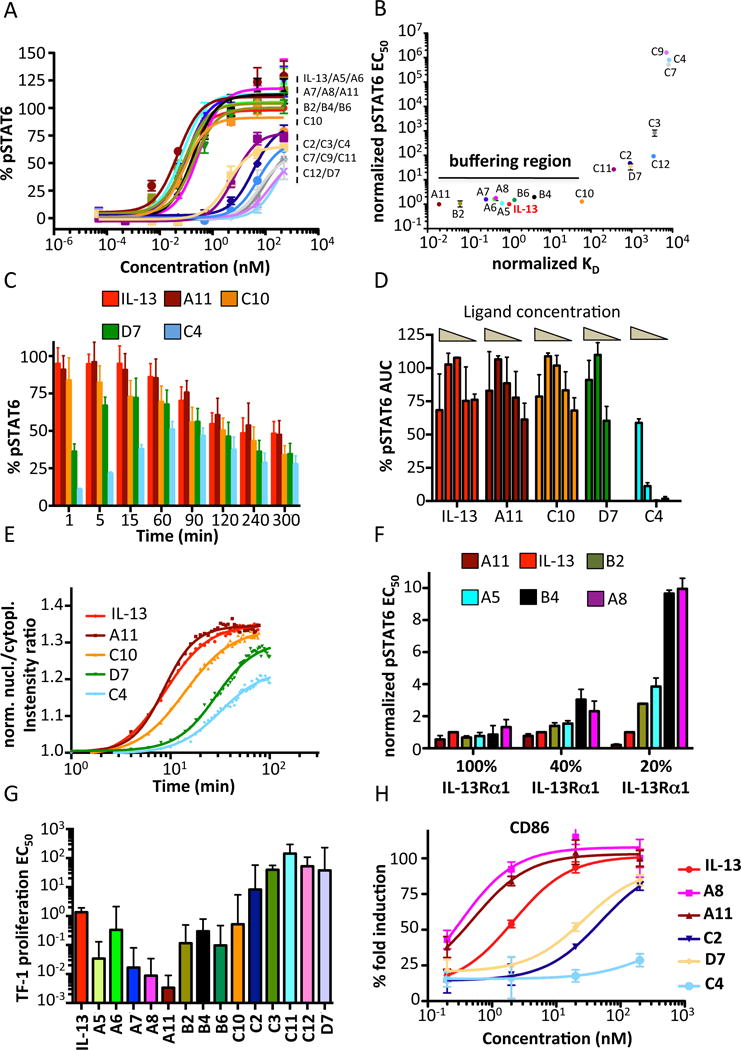
Figure 5. STAT6 activation profile in response to IL-13 agonist.

(A) A549 cells were stimulated with the indicated doses of IL-13 wt or IL-13 agonists and the levels of pSTAT6 were analyzed by flow cytometry, using anti-pSTAT6-specific antibodies coupled to fluorescent dyes. Sigmoidal curves were fitted with Prism software (GraphPad) (B) Dot plot graph in which the normalized pSTAT6 EC50 values are plotted against the normalized KD binding values for each IL-13 agonist. IL-13 pSTAT6 EC50 and KD values were set to one and agonist parameter values were normalized accordingly. Agonists binding within 100-fold of IL-13 wt in either direction lead to similar profiles of STAT6 activation, generating the denoted buffering region. (C) A549 cells were stimulated with 200 nM of IL-13 wt or the indicated IL-13 agonists and the kinetics of STAT6 phosphorylation were analyzed by flow cytometry. (D) Total levels of pSTAT6, calculated by measuring Area Under the Curve (AUC) from the kinetics studies shown in Figure S6. Decrease in ligand concentration only marginal affect total amount of pSTAT6 activated. (E) HeLa cells were stimulated for the indicated time-lengths with 200 nM of IL-13 or the indicated agonists and the translocation of mEGFP-STAT6 to the nucleus was measured via fluorescence microscopy. (F) A549 cells were transfected with different concentrations of IL-13Rα1 siRNA to obtain a range of IL-13Rα1 silencing. Cells were then stimulated with IL-13 wt or engineered agonists and pSTAT6 levels were quantified by flow cytometry. (G) TF-1 EC50 proliferation values obtained from fitting sigmoidal profiles to the dose-response curves shown in Fig. S10b. (H) Upregulation of CD86 in monocytes stimulated with the indicated doses of IL-13 wt and IL-13 mutants.
