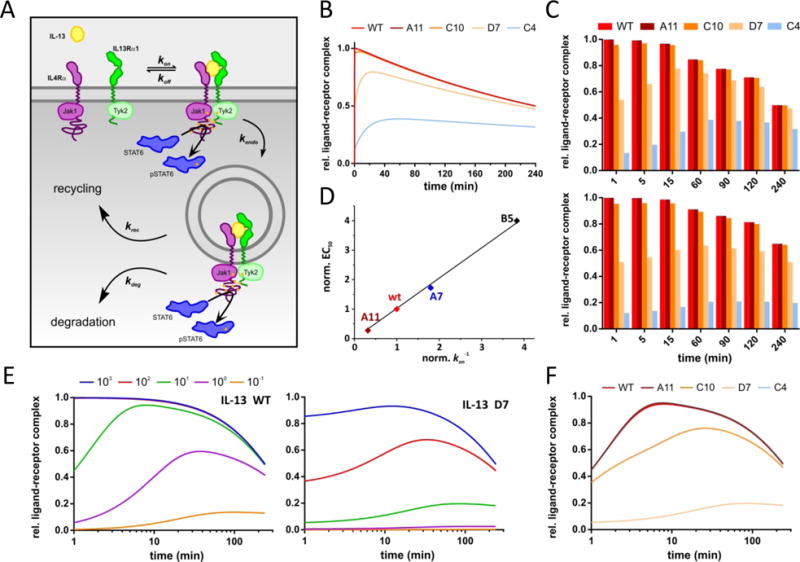
Figure 8. Quantitative model of IL-13 signaling.

(A) Steady-state model of ligand binding, receptor endocytosis and further endocytic trafficking used for simulations of STAT6 phosphorylation kinetics and dose-response curves. (B) Kinetics of STAT6 phosphorylation obtained for different IL-13 agonists. (C) Comparison of simulated STAT6 phosphorylation in absence (top) and in presence (bottom) of an endocytosis inhibitor. (D) EC50 values from dose-response curves simulated for different IL-13 agonists with different kon. (E) Kinetics of STAT6 phosphorylation obtained for different IL-13 wt concentrations (given in nanomolar). (F) Comparison of simulated STAT6 phosphorylation kinetics for different IL-13 agonists at a concentration of 10 nM.
