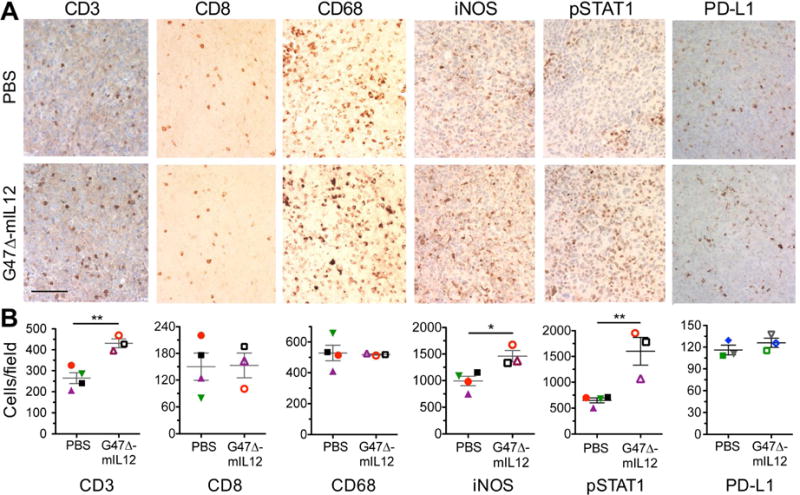
Figure 2. Immunohistochemical staining of immune cell markers after G47.

(A–B) Δ-mIL12 treatment. (A–B) 005 GSCs (2 × 10⁴) implanted on day 0, injected intratumorally (IT) with G47Δ-mIL12 (1 × 10⁵ pfu; n=3) or PBS (n=4) on days 18 and 24, animals sacrificed on day 25, and brains collected. Brain tumor sections were stained as indicated. For PD-L1 brain sections, 005 GSCs (2 × 10⁴) implanted on day 0, injected IT with G47Δ-mIL12 (5 × 10⁵ pfu; n=3) or PBS (n=3) on days 17, animals sacrificed on day 24, and brain tumor sections stained with anti-PD-L1 antibody. Representative images are presented; scale bar=100 μm (A). The number of positive cells from 3–9 fields/tumor section (1 section/mouse, except 3 for CD3) were counted (B). Average number of positive cells from each individual mouse is identified by symbol and color. The mean ± SEM of all mice is presented. Data were assessed by Student’s t test; *p<0.05; **p<0.001. See also Figure S1.
