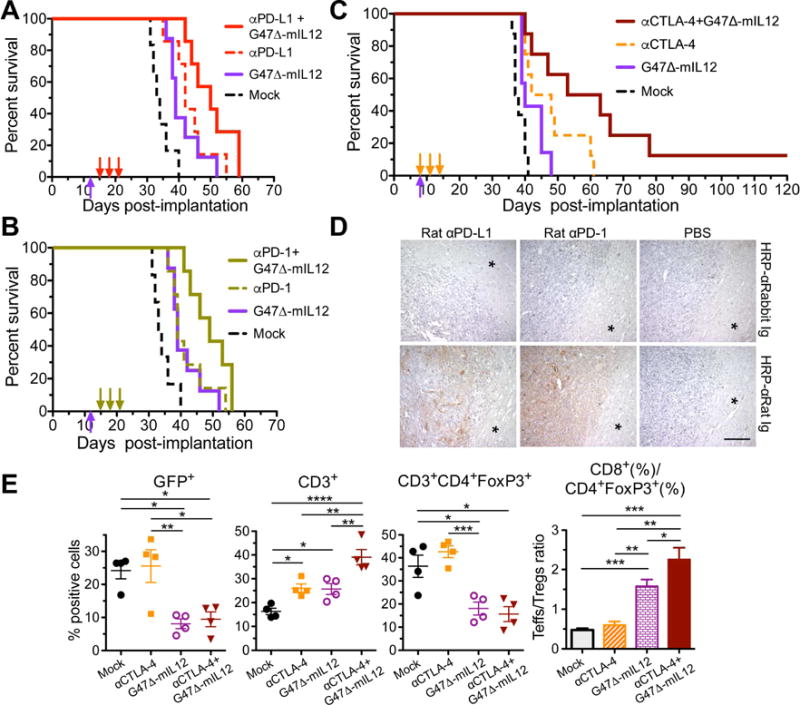
Figure 3. Treatment of 005 GSC-derived tumors with systemic immune checkpoint inhibitors, intratumoral G47 Δ-mIL12, or the combination prolongs survival.

(A–B) Mice implanted with 2 × 10⁴ 005 GSCs on day 0, treated with G47Δ-mIL12 (5 × 10⁵ pfu) or PBS injected IT on day 12 (upward arrow) and isotype control IgG (10 mg/kg), anti-(α)PD-L1 antibody (A), or anti-(α)PD-1 antibody (B) injected IP on days 15, 18 and 21 (downward arrows). Values from a single experiment, with Mock (treated with PBS and IgG) and G47Δ-mIL12 groups the same in A and B. Median survival of Mock (33.5 days; n=6) was compared to anti-PD-1 (39 days; n=8, p=0.02), anti-PD-L1 (42 days; n=7, p=0.003), or G47Δ-mIL12 (39 days; n=8, p=0.01) by Log-rank analysis. Similarly, G47Δ-mIL12 was compared to the combination of G47Δ-mIL12 with anti-PD-1 (49 days; n=7, p=0.02) or -PD-L1 (50 days; n=7, p=0.03), and antibodies were compared to the combination of G47Δ-mIL12 with anti-PD-1 (p=0.053) or anti-PD-L1 (p=0.08). Experiment was conducted once (A) or twice (B). C. Mice implanted with 2 × 10⁴ 005 GSCs on day 0 and treated with G47Δ-mIL12 or PBS injected IT on day 8 and anti-(α)CTLA-4 antibody or isotype control IgG (5 mg/kg) injected IP on days 8, 11 and 14 (n=8/group, except for G47Δ-mIL12 n=7). Median survival of Mock (37.5 days) was compared to anti-CTLA-4 (45 days; p=0.002) or G47Δ-mIL12 (40 days; p=0.03) alone by Log-rank analysis. Similarly, combination of G47Δ-mIL12 with anti-CTLA-4 (58 days) was compared to anti-CTLA-4 (p=0.05) or G47Δ-mIL12 (p=0.008). Experiment was conducted 2 times. D. Mice implanted with 2 × 10⁴ 005 GSCs on day 0, treated with PBS (right; n=2), rat anti-(α)PD-1 antibody (middle; 200 μg/mouse; n=2), or rat anti-(α)PD-L1 antibody (left; 200 μg/mouse; n=2) injected IP on day 25, and sacrificed 3 hr later. Antibodies were detected with HRP-conjugated anti-(α)rat Ig (brown; right) or control HRP-conjugated anti-(α)rabbit Ig (left). * normal brain adjacent to tumor. Scale bar=100 μm. E. 005 GSCs (1.5 × 10⁵) implanted on day 0, treated with PBS or G47Δ-mIL12 (5 × 10⁵ pfu) IT on day 11 and IgG or anti-CTLA-4 antibody (5 mg/kg) injected IP on days 11, 14, and 17 (n=4/group; Mock=PBS/IgG), and mice sacrificed on day 18. Tumors were harvested, cells stained with fluorochrome-conjugated anti-mouse antibodies, and multicolor FACS performed. Scatter plot (each animal 1 point) of the percentages of live sorted positive cells. The ratio of Teff to Treg ratio is presented in a bar graph. Mean ± SEM. Data were assessed by Student’s t test between indicated groups; *p<0.05, **p<0.01, ***p<0.001, ****p<0.0001. See also Figure S2 and S3.
