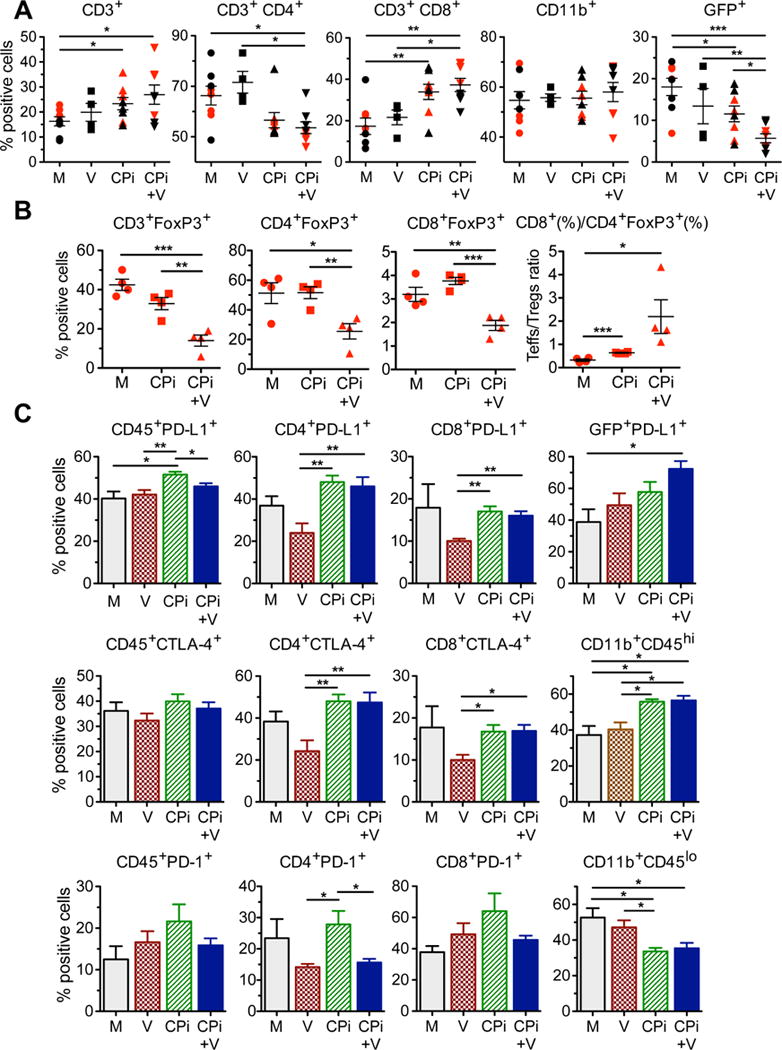
Figure 5. FACS analysis of treatment effects of triple combination therapy.

(A–C) Mice implanted with 005 GSCs (1.5 × 10⁵) on day 0, treated with G47Δ-mIL12 (5 × 10⁵ pfu) or PBS injected IT on day 11, and anti-PD-1 and anti-CTLA-4 antibody or rat and hamster IgGs (Mock) (5 mg/kg hamster IgG and 10 mg/kg rat IgG) injected IP on days 11, 14, and 17 (n=4), and sacrificed on day 18. Tumors harvested, dissociated cells stained with fluorochrome-conjugated anti-mouse antibodies, and multicolor FACS was performed. Percentages of live CD3+ cells, CD3+ sorted CD4+ and CD8+ subsets, live CD11b+ (monocytes, macrophages, NK, DC), and live CD45− GFP+ 005 cells from 2 independent experiments (red and black symbols) for M, CPi, V, and CPi+V groups (symbols are individual mice) were analyzed (A). The tumors from the experiment with red symbols in (A) were analyzed for CD3+FoxP3+ subtypes and ratio of CD8+ to CD4+FoxP3+ (B). The tumors from the experiment with black symbols in (A) were analyzed for immune checkpoint expression (PD-L1, CTLA-4, PD-1) on CD45+CD3+CD4+ and CD8+ subsets, CD45−GFP+, and CD11b+CD45hi and lo cells (C). M, Mock (PBS/IgG); V, virus (G47Δ-mIL12); CPi, checkpoint inhibitors (anti-PD-1+anti-CTLA-4); CPi+V, virus + checkpoint inhibitors (G47Δ-mIL12+anti-PD-1+anti-CTLA-4). Data are mean ± SEM and assessed by Student’s t test between indicated groups; *p<0.05, **p<0.01, ***p<0.001. See also Figure S5.
