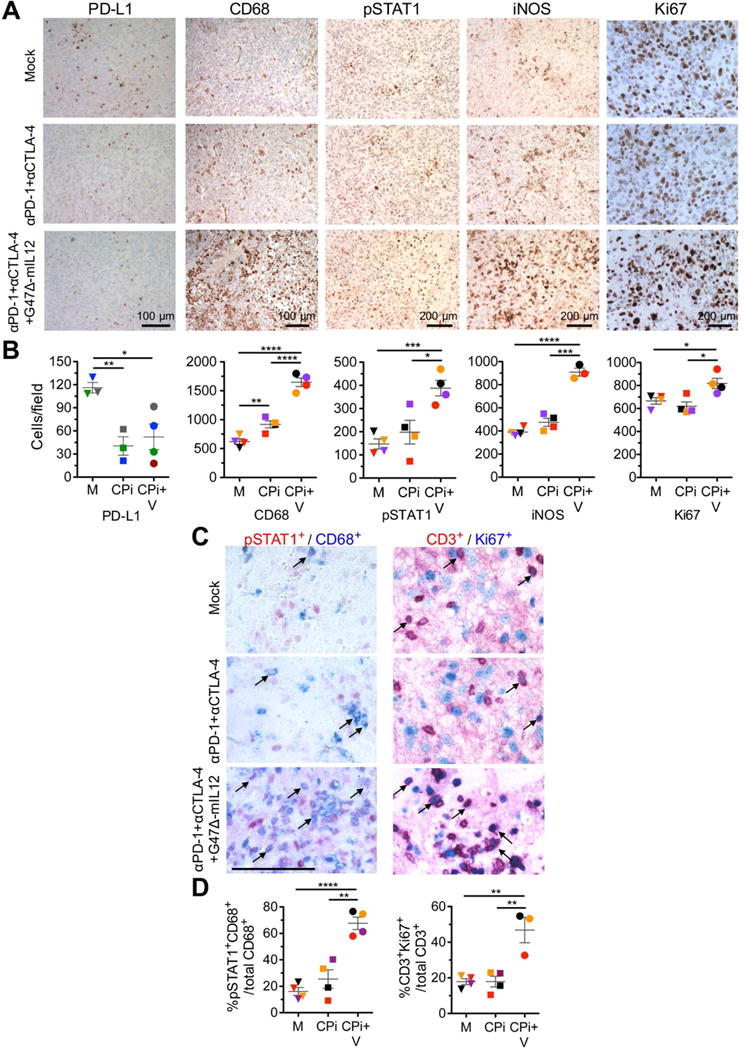
Figure 6. Immunohistochemical staining of tumor infiltrating cells.

(A–D) Mice implanted with 005 GSCs (2 × 10⁴) on day 0, treated with G47Δ-mIL12 (5 × 10⁵ pfu) or PBS injected IT on day 17, and checkpoint inhibitors anti-PD-1 antibody and anti-CTLA-4 antibody or rat and hamster IgGs (5 mg/kg hamster IgG and 10 mg/kg rat IgG) injected IP on days 17, 20, and 23 (n=4), sacrificed on day 24, and brain tumor sections stained as indicated (Mock; PBS/IgG). Representative images with positive cells stained brown are presented (A). PD-L1 staining was from a separate experiment, but same treatment as above (n=3 or 4). Scale bars=100 or 200 μm as indicated. Number of positive cells per field in (A) were counted (3–5 fields/section/mouse for CD68 and Ki67; 8–10 fields/section/mouse for pStat1 and iNOS; 4 fields/section and 2 sections/mouse for PD-L1), and individual mice in each group are identified by color (B). Representative images with positive cells stained red (pSTAT1 +, CD3+), blue (CD68+, Ki67+), and red/blue colocalized (examples indicated with arrows) are presented (C). Scale bar=100 μm. Brain sections were incubated sequentially with primary (pSTAT1 or CD3 rabbit antibody) and secondary antibodies (AP-conjugated anti-rabbit Ig), followed by red color development. The same sections were then incubated with primary (CD68 or Ki67; rabbit antibody) and secondary antibodies (AP-conjugated anti-rabbit Ig), followed by blue color development. Number of positive cells per field were counted (8–10 fields/section/mouse) and percent of double positive cells plotted (D) with individual mice identified by color. M, Mock (PBS/IgG); CPi, checkpoint inhibitors (anti-PD-1+anti-CTLA-4); CPi+V, checkpoint inhibitors + virus (G47Δ-mIL12+anti-PD-1+anti-CTLA-4). Data are mean ± SEM, assessed by Student’s t test between indicated groups; *p<0.05, ***p<0.001, ****p<0.0001. See also Figure S6.
