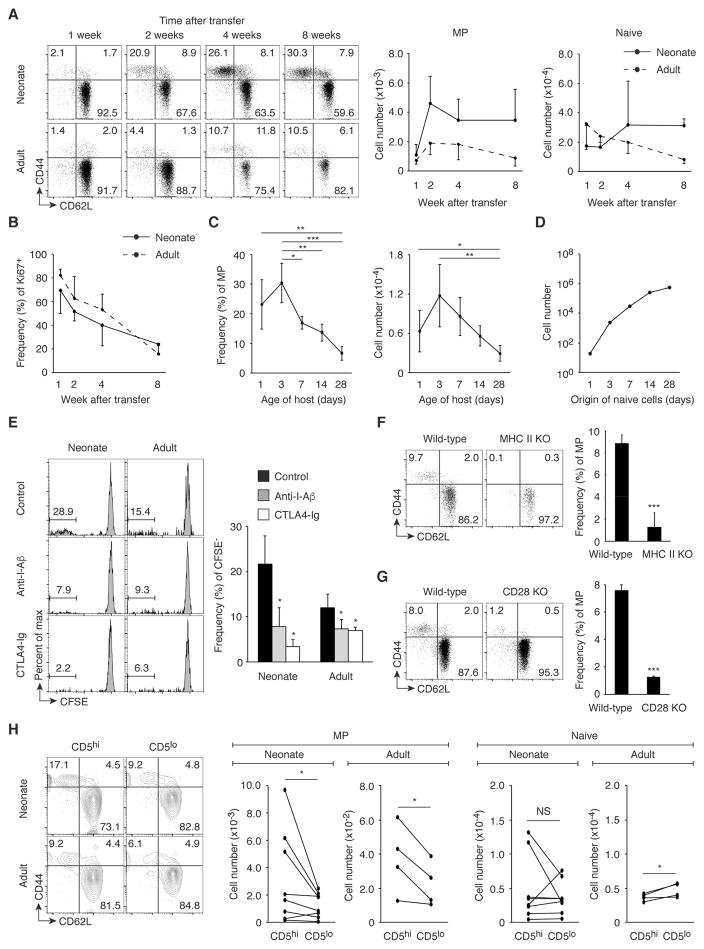
Fig. 2. MP cell conversion occurs in both neonates and adults dependently of TCR and CD28 signaling.
(A and B) Naïve CD4+ T lymphocytes give rise to MP cells in neonatal and adult mice. Sorted naïve CD4+ T cells from CD45.2 wild-type mice were transferred into 1-day-old neonatal or 8-week-old adult CD45.1/2 animals, and donor cells were analyzed in the spleen 1, 2, 4, and 8 weeks later. Representative dot plots show CD44 and CD62L expression by the donor cells and the graphs show (A) the number (mean ± SD) of MP and naïve donor cells and (B) the frequency (mean ± SD) of Ki67+ cells among MP donor cells (n=3–8). Data shown are pooled from 2 independent experiments. (C) The MP conversion rate correlates with age of host animals. Sorted naïve CD4+ T cells from CD45.2 mice were transferred into 1, 3, 7, 14, 28-day-old CD45.1/2 mice and the donor cells were analyzed for CD44 and CD62L expression 6 weeks later. The graphs show the frequency and the number (mean ± SD) of MP cells among the donor cells at each time point (n=3–7). Data shown are pooled from 3 independent experiments. (D) The MP conversion rate decreases, but the absolute number of generated MP cells increases with age. The number of MP cells that naïve CD4+ T cells from 1, 3, 7, 14, 28-day-old mice can generate 6 weeks later was calculated based on the absolute number of naïve CD4+ T lymphocytes obtained in Fig. 1B and the MP conversion rate obtained in Fig. 2C. (E) Fast proliferation of naïve CD4+ T lymphocytes requires TCR and CD28 signaling in neonates and adults. Sorted, CFSE-labeled naïve CD4+ T cells from CD45.2 wild-type mice were transferred into 1-day-old neonatal or 8-week-old adult CD45.1/2 recipients that were treated with anti-I-Aβ, CTLA4-Ig, or control IgG and were analyzed 3 weeks later. Representative histograms indicate CFSE dilution of the donor cells in the spleen, while the bar graph shows the frequency (mean ± SD) of CFSE− cells among donor cells from each group (n=2–3). (F) MP cell generation requires host MHC II expression. CD45.1 naïve CD4+ T cells were transferred into CD45.2 wild-type or MHC II KO mice and were analyzed 3 weeks later. Representative dot plots display CD44 and CD62L expression of donor cells, while the graph shows the frequency (mean ± SD) of MP population among donor cells (n=3). (G) MP cell generation depends upon CD28 signaling. The dot plots show expression of CD44 and CD62L by CD4+ T cells from wild-type and CD28 KO mice while the bar graph shows the frequency (mean ± SD) of MP cell population among CD4+ T cells (n=3). (H) CD5hi naive cells can generate more MP cells than CD5lo cells. Sorted CD5hi and CD5lo naïve CD4+ T cells from CD45.2 and CD45.1 mice, respectively, were transferred at a 1:1 ratio into 1-day- and 8-week-old CD45.1/2 recipients and were analyzed 3 weeks later. Representative plots indicate CD44 and CD62L expression by the donor cells in the spleen while the graphs show the number of MP and naïve cells generated from paired CD5hi and CD5lo naïve donor cells in an individual host mouse (n=4–8). Data are pooled from 2 independent experiments. * p<0.05, ** p<0.01, *** p<0.001, NS not significant.

