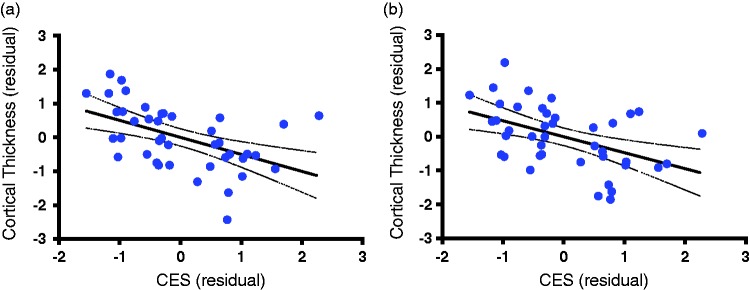
Figure 2.
Scatter plots of cortical thickness and combat exposure severity. The scatter plots indicate the extracted average cortical thickness, showing the negative slop correlating CES and cortical thickness residuals (i.e., after regressing the effects of age, ELS, and Group (PTSD diagnosis status). (a) The scatter in the significant cluster found in the superior frontal region (r = −0.50, n = 41, p = 0.0008). (b) The scatter in the rostal middle frontal region (r = −0.47, n = 41, p = 0.0018).

