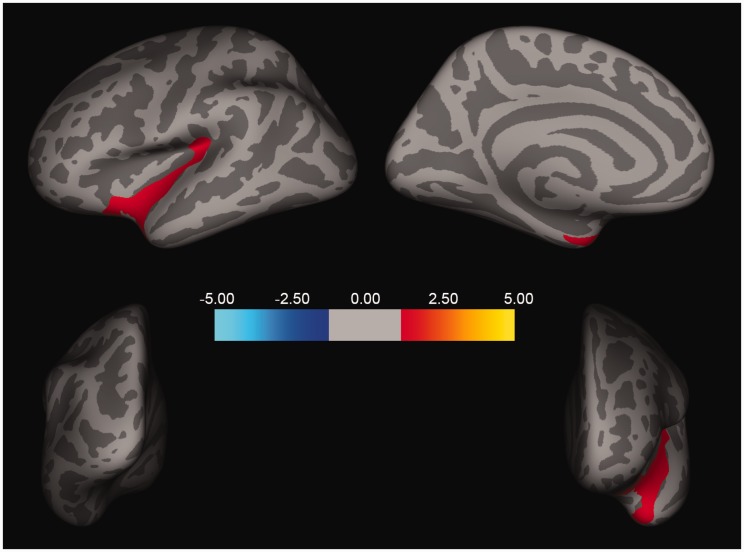
Figure 3.
Interaction of PTSD diagnosis status/group, CES, and cortical thickness. One cluster in the superior temporal/insular region (size = 2077.41 mm2, xyz = −32, −32, 17; z = −1.47, p < 0.05) remained significant following cluster correction, demonstrating the interaction between group (PTSD diagnosis status) and CES. A stronger negative correlation is found between CES and cortical thickness in combat-exposed control group, compared to the PTSD group.

