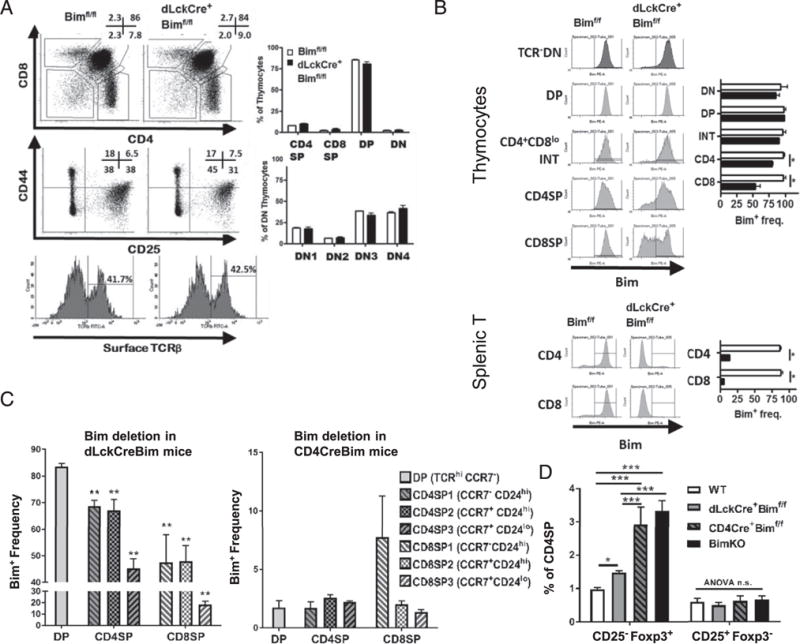
FIGURE 3.

Deletion of Bim at the late DP stage fails to promote TCR+ DN thymocytes. (A) Thymocytes from Bimf/f or dLckCre+Bimf/f mice (n = 4) were stained with Abs and analyzed by flow cytometry. Numbers in representative dot plots show the frequency of corresponding populations. Expression of surface TCRβ on CD25−CD44− DN thymocytes is shown in histograms. The bar graphs show the frequency of each population from either Bim (open bars) or dLckCre+ Bimf/f (filled bars) mice. (B) Thymocytes or splenic T cells from Bimf/f or dLckCre+Bimf/f mice were stained with cell surface markers and intracellularly for Bim. Data in representative histograms show Bim levels in various gated thymic subpopulations, and the bar graphs show the frequency of Bim+ cells in thymic subpopulations from either Bimf/f (open bars) or dLckCre+Bimf/f (filled bars) mice. (C) The bar graphs show the frequency of Bim+ thymocytes in TCR+CCR7− DP, SP1 (CCR7−CD24hi), SP2 (CCR7+CD24hi), or SP3 (CCR7+CD241o) stages from either dLckCre+Bimf/f (left panel) or CD4Cre+Bimf/f (right panel) mice. Statistical comparison was made between each SP subset to DP cells. (D) Thymocytes from C57BL/6, dLckCre+Bimf/f, CD4Cre+Bimf/f, or Bim−/− mice (n = 4–5) were stained with Abs and analyzed by flow cytometry. The frequencies of thymic Treg precursor populations, CD25−Foxp3+ cells, or CD25+Foxp3− cells among CD4SP cells are shown. Results are representative of at least two independent experiments and are shown as mean ± SD. *p < 0.05, **p < 0.01.
