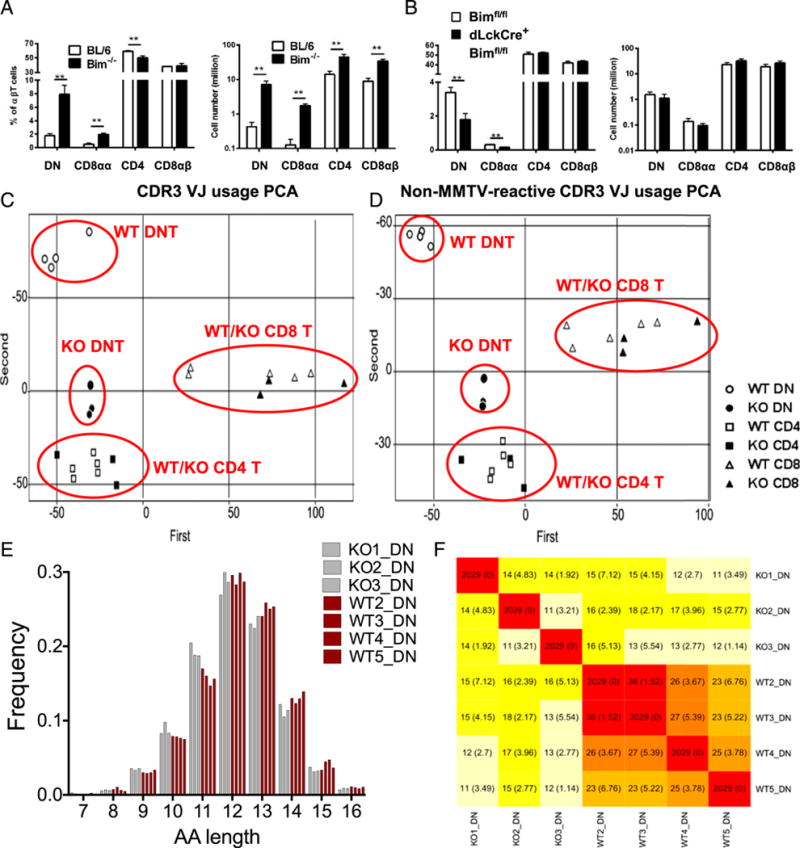
FIGURE 5.

Bim deletion results in DN and CD8αα T cell accumulation in the spleen with distinct TCR repertoire. (A) The bar graphs show the percentage of splenic DN (CD4−CD8α−), CD8αα (CD4−CD8α+CD8β−), CD4 (CD4+CD8α−), or CD8αβ (CD4−CD8α+CD8β+) αβT cells (TCRβ+ CD19−MHC II− NK1.1−), as well as the total cell number, from either C57BL/6 (BL/6; open bars) or Bim−/− (filled bars) mice. (B) The bar graphs show the percentage and the total number of splenic DN, CD8αα, CD4, or CD8αβ T cells from Bimf/f (open bars) or dLckCre+Bimf/f (filled bars) mice. Results are representative of at least two independent experiments (n ≥ 3 in each group) and show mean ± SD. *p < 0.05, **p < 0.01. (C) Different T cell populations were sorted from an individual BL/6 or Bim−/− mouse, and the TCRβ CDR3 repertoires were sequenced by the Illumina MiSeq system. About 2 million reads were obtained and further normalized and analyzed with MiTCR or tcR software. The scatter plot shows the result of PCA in TCRβ CDR3 V-J chain usage. The clusters of different cell populations are labeled on the plot. (D) The scatter plot shows the result of PCA in CDR3 V-J chain usage after removal of mouse mammary tumor virus-reactive TCRβ (TRBV12, TRBV16, and TRBV24) (50, 51). The clusters of different cell populations are labeled on the plot. (E) The TCRβ CDR3 lengths (in amino acid [AA] numbers) in DN T cells from either BL/6 (red bars) or Bim−/− (gray bars) mice are plotted. The lengths were analyzed with two-way ANOVA showed significant difference (11 aa, p < 0.001; 13 aa, p < 0.05). (F) The heat map shows the average number (and SD) of public TCRβ CDR3 sequences shared by different mouse among 2029 random subsampled sequences. BL/6, C57BL/6.
