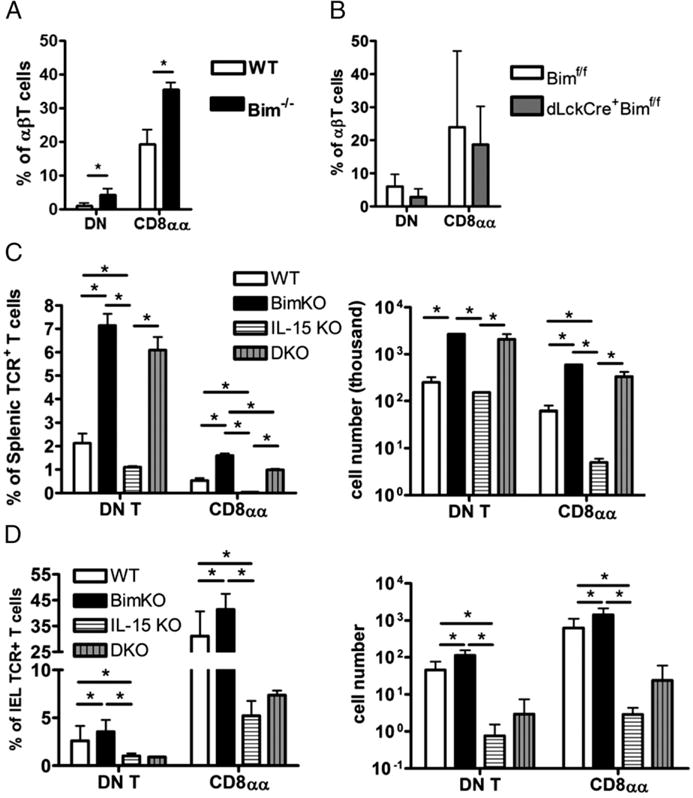
FIGURE 6.

Bim deletion rescues the splenic DN T cells, but not iIELs, in IL-15 knockout (KO) mice. (A) The bar graphs show the percentage of small intestinal intraepithelial DN (CD4−CD8α−) T or CD8αα (CD4−CD8α+ CD8β−) T cell amounts in intraepithelial αβT cells (TCRβ+ CD19−MHC II−NK1.1−) from either BL/6 (open bars), Bim−/− (black bars), or (B) dLckCre+Bimf/f (gray bars) mice. (C) The bar graphs show the percentage of splenic DN T or CD8αα T cells, as well as the total cell number, from either C57BL/6 (BL/6; open bars), Bim−/− (black bars), IL-15 KO (horizontal-striped bars), or IL-15−/− Bim (double knockout [DKO], vertical-striped bars) mice. (D) The graphs show the percentage and the total number of small intestinal intra-epithelial DN T or CD8αα T cells from either BL/6 (open bars), Bim−/− (black bars), IL-15 KO (horizontal-striped bars), or IL-15−/− Bim−/− (DKO, vertical-striped bars) mice. Results are representative of at least two independent experiments (n ≥ 3 in each group) and show mean ± SD. *p < 0.05. BL/6, C57BL/6; DKO, double knockout; KO, knockout.
