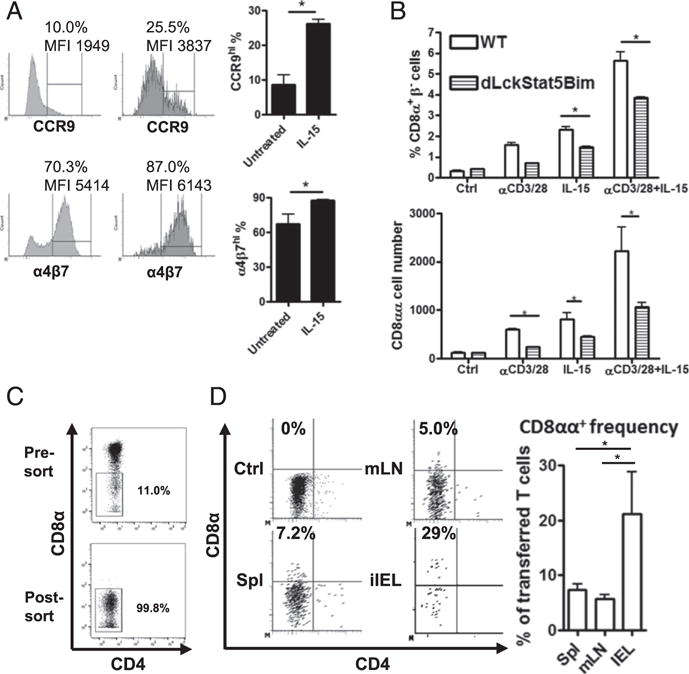
FIGURE 7.

Splenic DN T cells in vitro and in vivo develop into CD8αα T cells, partially depending on IL-15/Stat5 signaling. (A) Induction of CCR9 and α4β7 expression in splenic DN T cells. The sorted splenic DN T cells (CD4−CD8α−TCRβ+ CD19−MHC II−NK1.1−) from Bim−/− mice were cultured with 20 ng/ml rIL-15 for 48 h. The represented histograms of CCR9 or α4β7 expression are shown. The frequency (percentage) and mean fluorescence intensity (MFI) of a CCR9hi or α4β7hi population are noted on the plots. The bar graphs show the CCR9hi or α4β7hi percentage within ex vivo splenic DN T cells (untreated) or IL-15–induced CD8αα T cells (IL-15). (B) The splenic DN T cells were isolated from either C57BL/6 (BL/6) or dLckCre+Bimf/f Stat5f/f mice and cultured with plate-bound anti-CD3/CD28 Ab and/or 20 ng/ml rIL-15 for 24 h. The CD8αα T cell frequency and number in the culture were analyzed by flow cytometry. (C) The splenic DN T cells (CD4−CD8α−CD19−NK1.1−MHC II−) were isolated from Bim−/− mice. A represented presort plot and a postsort plot with DN T cell frequency among αβT cells is shown. (D) The sorted DN T cells were adoptively transferred into immune-intact BoyJ recipients. After 7 d, T cells in spleen, mesenteric lymph node (mLN), and small intestinal epithelium were analyzed by flow cytometry. The representative dot plots show CD8α and CD4 expression of the donor αβT cells first gated on CD8β− (CD45.2+TCRβ+CD8β−), and the frequency represents the CD8αα T cell amounts in donor cells. Results are representative of at least two independent experiments and show mean ± SD. *p < 0.05. BL/6, C57BL/6; MFI, mean fluorescence intensity; mLN, mesenteric lymph node.
