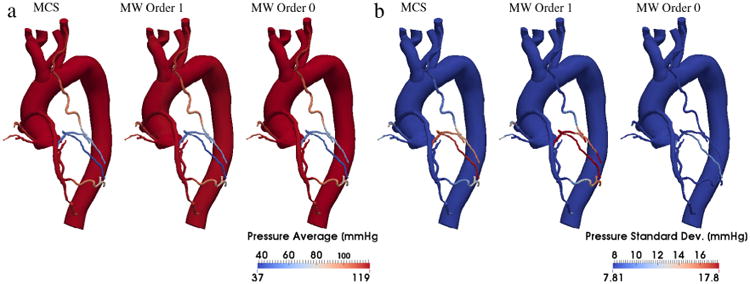
Fig. 16.

Contour plot representing the estimates of the average pressure (a) and its standard deviation (b) on a three-dimensional multi-scale model of the aorta and coronary circulation. The statistics of the proposed multi-resolution approach are compared to those obtained from Monte Carlo sampling, computed over 64 realizations.
