
Fig. 3.
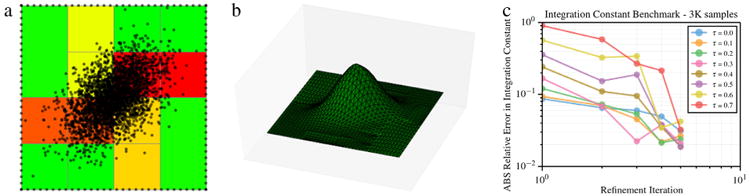
Computing the integration constant of a variably correlated multi-variate Gaussian with multi-resolution regression. The sample distribution and refined hypercube partitions are shown for τ = 1/2 (a), together with the reconstructed distribution (b) and convergence plots in terms of the absolute (ABS) relative error between the estimate and the true integration constant (c).