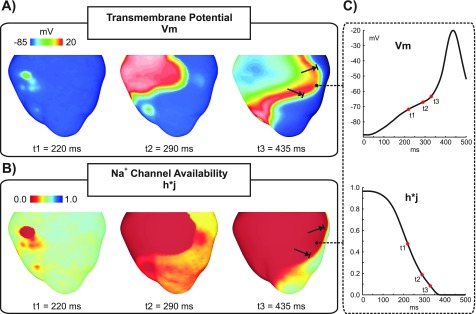
FIG. 6.
Conduction block of a PVC. (a) Vm distributions in the BiV model at time instants: t1 = 219 ms, the time of the PVC; t2 = 290 ms, when the wavefront is advancing into the LV; and t3 = 435 ms, time of conduction block in the LV. (b) maps at the same time instants as in (a). (c) Vm and traces at the location indicated by an asterisk in (a) and (b).

