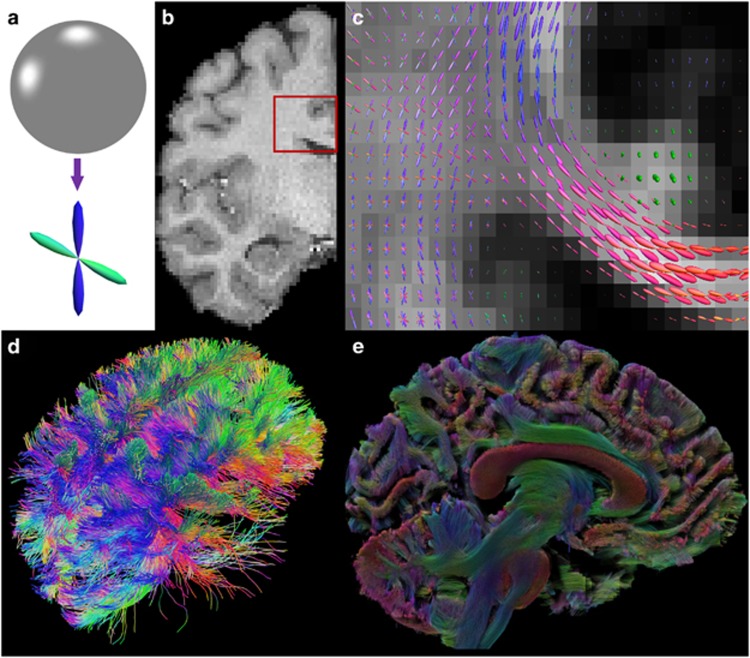
Figure 2.
An illustration of fiber orientation distribution (FOD) reconstructed from Human Connectome Project (HCP) data with the method we developed recently.64 (a) FOD is a function on the unit sphere (top) and can be visualized as a 3D shape (bottom) by modulating the radius of the shape according to the magnitude of the FOD function. For an region of interest (ROI) shown as the red box in (b), the FODs are visualized in (c). (d) With FOD-based tractography, a more complete representation of the corpus callosum can be reconstructed. The lateral projections of the corpus callosum were successfully captured. As shown in (e), a volume rendering can be created with 3 million fiber tracts to visualize the connectome of the human brain.

