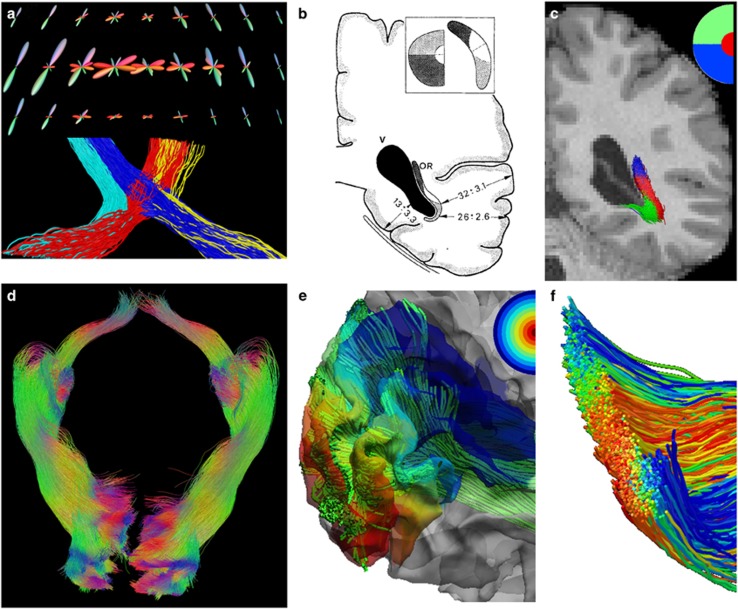
Figure 4.
Retinofugal visual pathway reconstruction results. (a) Top: fiber orientation distributions (FODs) at the optic chiasm; Bottom: the ipsilateral and contralateral branches of the optic tracts were reconstructed from the FODs. Reconstructed fiber bundles from an Human Connectome Project (HCP) subject. (b) Postmortem dissection result99 shows the retinotopic organization of the optic radiation. (c) Retinotopic parcellation of the left optic radiation fiber bundle reconstructed by our method as shown in (a). Red, blue, green represent fiber projecting to the foveal, superior and inferior quadrant of the peripheral visual field, respectively. (d) The reconstructed retinofugal pathways including the optic tract and optic radiation of both hemispheres. (e) Using the cortical projection of the visual pathway, detailed retinotopic coordinates (eccentricity, angle) can be assigned to each fiber tract. Here the eccentricity map is plotted as a colored map on the cortex. (f) A cross section of the optic radiation bundle with tracts colored by the eccentricity as defined through their projection onto V1.

